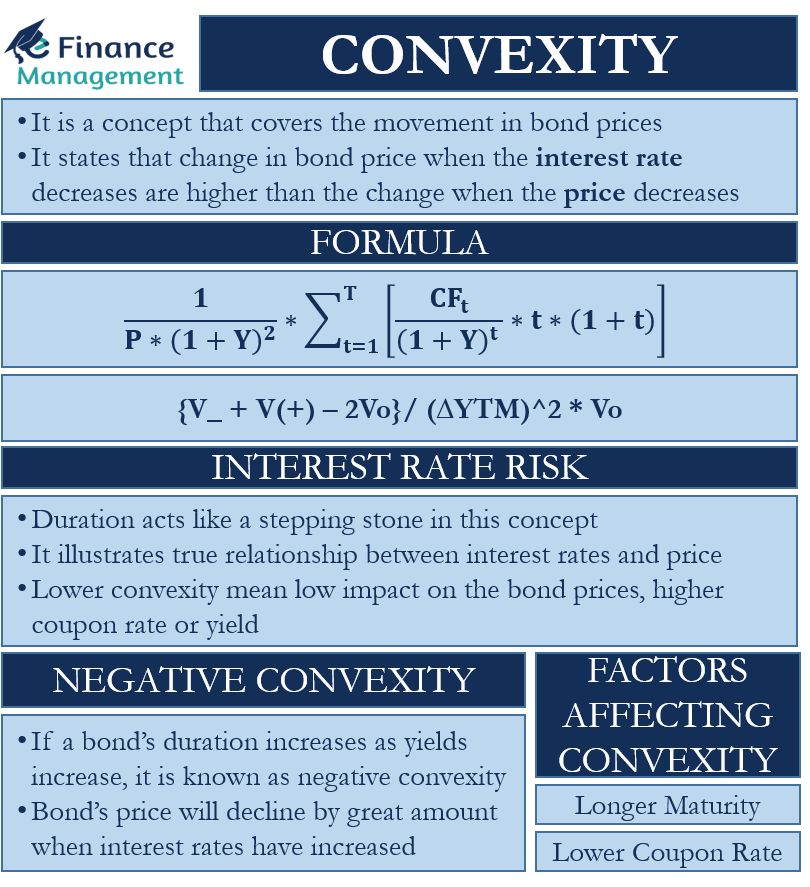
Understanding the Term: Convexity
Understanding convexity starts by understanding the basic rule of bond prices. As per the standard rule, there is an inverse connection between the interest rate and bond prices. To put it simply whenever there is an increase in the interest rates, the bond prices will decrease. Conversely, as the interest rates decrease, the bond prices increase. When interest rates increase, the payout of the current bond decreases in comparison to the prevailing market rate. In simple terms, convexity is a concept that covers the movement in bond prices. The concept of convexity states that the change in bond price when the interest rate decreases are higher than the change when the price decreases.
Understanding Bond Convexity with Graph
As we know, there is an inverse relationship between the price of the bond and the yield. So ideally, the negative slope should be represented as a straight line on the graph. But the relationship forms a curved line on the graph. This is where the concept of convexity comes into play. The resultant curve is due to the degree of difference when the yield changes. Hence, the change in the price is higher when the yield decreases compared to the change in the price when the yield increases.
| Future Value | 1000 |
| No. of Years | 30 |
| Coupon Rate | 10% |
| YTM | Bond Price ($) |
|---|---|
| 5% | 1,768.62 |
| 6% | 1550.59 |
| 7% | 1372.27 |
| 8% | 1225.16 |
| 9% | 1102.74 |
| 10% | 1000.00 |
| 11% | 913.06 |
| 12% | 838.90 |
| 13% | 775.13 |
| 14% | 719.89 |
| 15% | 671.70 |
| 16% | 629.37 |
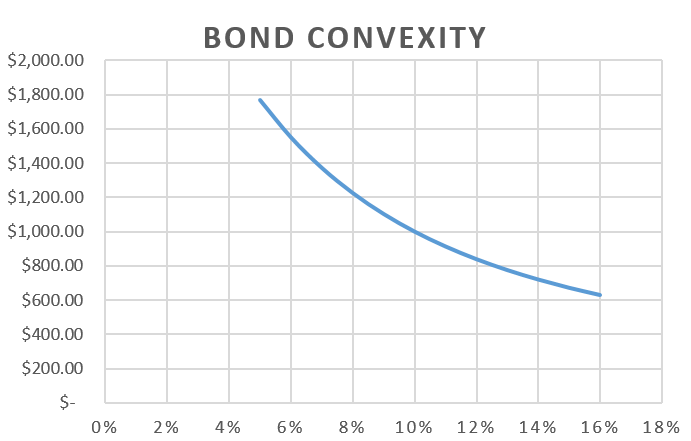
In the graph above, a range of YTM increases, and the resultant price is plotted. The assumed coupon rate is 10%, the years of maturity of the bond is 30 years and the Face value is 1000.
Convexity Formula and Calculation
The formula for convexity calculation is as given below:
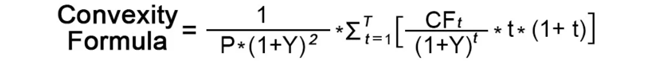
CFt = Cash Flow at Time t
Convexity Approximation Formula
If we make the calculation of convexity from this formula then the process is quite long and tedious. More so when the period is quite long and a number of cash flows are involved. Therefore, the experts generally use the Approximation Formula which is as given below:
The formula for convexity is = {V_ + V(+) – 2Vo}/ (∆YTM)^2 * Vo
Here, V_ is the price when the yield decreases, and V(+) is the price when the yield increases.
∆ YTM = It is a change in YTM Vo = Current Bond price
Example of Bond Convexity
Using the same example above, let’s assume a yield change of 1%, with Bond prices at yield 9%, 10%, and 11%. The bond prices calculated using the Present formula (PV) at,
9% = $ 1,102.74
10% = $ 1000 (It is the face value itself as the Coupon = Yield)
11% = $ 913.06
Plugging in the values in the formula we get,
(1,102.74 + 913.06 – 2*1000)/ 0.01*0.01*1000
The convexity = 158
Duration of a Bond is a measure of convexity and tells us the sensitivity of a bond’s full price to a change in its yield. Whenever there is a higher duration of the bond, any increase in the interest rates will result in a far higher change in the bond prices. This change is of course very low if the bond tenure is low. So, if the interest rates are rising, an investor would prefer buying bonds with a lower duration. And therefore all financial and investment analysts advise for a reduction in the long maturity debt investments when the interest rate is expected to move up. Like in the current scenario wherein fed taper is round the corner and soft scenario is going to change over the next one year.
Convexity and Interest Rate Risk
Duration acts like a stepping stone for the concept of Convexity. Interest rate risk is better measured by convexity than duration, mainly duration assumes a linear relationship between interest rates and the price of the bond, which is not the case. Whereas, convexity illustrates the true relationship between interest rates and price. When talking about small changes in interest rates working with duration is still fine, but larger fluctuations demand the accuracy of convexity.
For example, the primary risk for fixed income securities is rising interest rates, because bondholders will now be attracted to issuing new securities that provide them higher returns. Hence, as convexity decreases, the risk of the portfolio also decreases when interest rates rise. Lower convexity will mean a low impact on the bond prices, a higher coupon rate or yield will play its role in offsetting the newly emerged risk from higher interest rates.
Factors affecting Convexity
The factors affecting convexity and duration are the same.
- A longer maturity,
- A lower coupon rate, or a lower yield to maturity will increase convexity and vice versa.
Negative and Positive Convexity
The convexity of option-free bonds is always positive conversely an option embedded, the callable bond can have negative convexity at low yields. If a bond’s duration increases as the yields increase, it is known as negative convexity. That is the bond’s price will decline by a great amount when the interest rates have increased.
