There are a few very important concepts when it comes to security analysis, such as DCF, CAPM, as well as CML, SML, and CAL. To better understand the risk and reward relation, as well as know the optimum portfolio allocation, it is a must for investors to have a good understanding of these concepts, especially SML and CAL. So, in this piece of writing, we will be discussing SML vs CAL.
CAL (Capital Allocation Line)
When we attempt to combine the portfolio of risk-free assets with the risky asset portfolio, a Capital Allocation Line comes up in the form of a Graph. Thus, CAL shows all the possible allocations and combinations between the risk-free and risky assets based on investor risk preferences. It basically tells investors about their potential return for a given level of risk along with the risk-free asset. That is why we call the slope of CAL the reward-to-variability ratio or Sharpe ratio. A higher slope suggests one may get more than the expected return by adding another risky asset.
In simple words, we can say that CAL assists investors in choosing their portfolio of risk-free and risky assets. Or how much an investor needs to invest in risk-free and risky assets so as to optimize their portfolio.
A point to note is CAL is sometimes referred to as CML (Capital Market Line). There is, however, a marginal variation between the two. Or, we may say that CML is a special type of CAL. One will get CML if we impose some conditions on the CAL. The Risk Portfolio becomes the Market Portfolio in the case of CAL. To know more about the differences between CML and SML, you can refer to our article: SML vs CML.
Also Read: SML vs CML – Meaning and Differences
Talking about the difference between the two, CAL represents a risk-free asset and a risky asset. On the other hand, CML represents the risk-free asset and the market portfolio.
Another difference is that all combinations on the CAL line are different for every investor as it depends on their individual risk preferences. On the other hand, combinations on CML are equal and the same for each individual.
SML (Security Market Line)
The security market line graphically represents the CAPM (capital asset pricing model). Basically, it shows the expected returns of assets depending on the non-diversifiable risk (or systematic risk). The beta of the security (against the market) helps to determine the risk.
There are three components of SML –
- Risk-free rate,
- The beta of the asset and
- The expected market risk premium.
- We can also use the SML to measure the risk premium of an asset. Following is the formula to determine the SML:
SML = Rf + {Beta * (Rm – Rf)}
Here Rf is the risk-free rate, and Rm is the expected market return of all risky assets.
An investor or an analyst can use the SML to find out whether or not the asset is overpriced or underpriced. For instance, if an asset provides more than the market return for a given level of systematic or beta risk, that means that every asset is underpriced. In the graphical presentation, we will found such assets placed above the security market line.
Also Read: Capital Market Line
On the other hand, if, however, the return offered by the asset is less than the market return for a given level of systematic risk, that means it is overpriced. Moreover, such assets will reflect/show in the graph below the security market line.

SML vs CAL – Differences
We have now got a good idea of SML and CAL by reading the above content. To make the two concepts more clear, the following are the differences between SML and CAL:
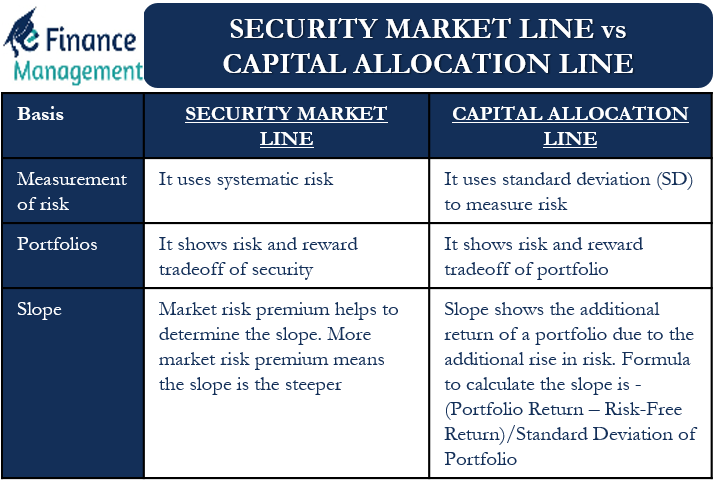
- CAL and CML use SD (standard deviation) as the risk measure. SML, on the other hand, uses systematic risk.
- CAL shows the risk and reward tradeoff of a portfolio. SML, in contrast, shows the risk and reward tradeoff of security.
- Market risk premium helps to determine the slope of the SML. This means more the market risk premium, the steeper the slope is. The slope of CAL shows the additional return of a portfolio due to the additional rise in risk. Formula to calculate the slope of CAL is (Portfolio Return – Risk-Free Return)/Standard Deviation of Portfolio.

