What is Capital Market Line?
Capital Market Line graphically represents all portfolios with an optimal combination of risk and return. They are the best-performing portfolios. Risk is represented by using a standard deviation on the x-axis, while the y-axis represents the expected return of a portfolio. It consists of a mix of risk-free assets and risky assets. They offer an optimal risk-return trade-off, i.e., maximum return on a given amount of risk or minimum risk on a given return.
The capital market line assumes the risk portfolio as a market portfolio. Graphically, a line is drawn that connects the market portfolio with the risk-free asset. This line is the capital market line. Portfolio risk and the return an investor expects are proportional to each other. The higher the investor climbs up the capital market line, the greater the portfolio risk and the expected return, and vice versa.
What is the equation of Capital Market Line?
The equation of the capital market line is as follows:
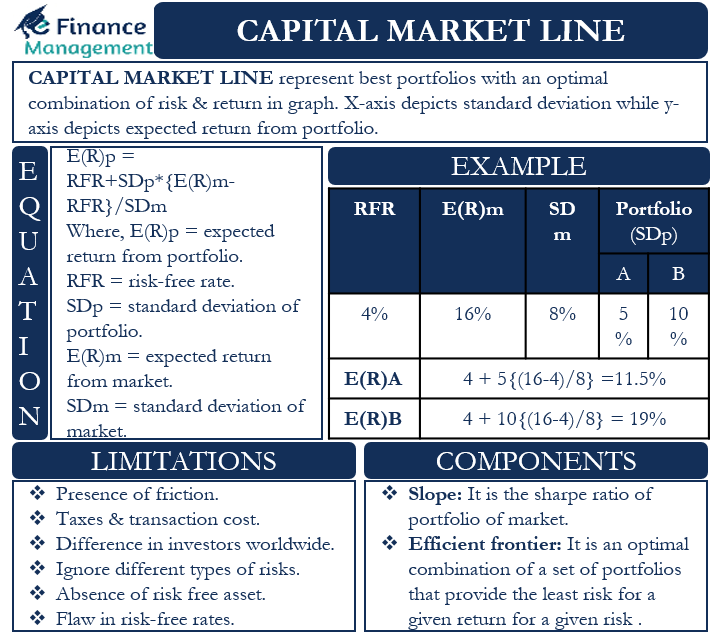
E (R)p= RFR + SDp * {E (R)m – RFR}/SDm
Here, E (R)p= The return an investor expects from a portfolio
RFR= Risk-free rate
SDp= Standard deviation of the portfolio
E (R)m= Expected return from the market
SDm= Standard deviation of the market
Example
Let us understand the above equation using an example. The risk-free rate is currently 4%, and the expected market return is 16%, with a standard deviation of 8%.
We have two different portfolios with which we can compare: the standard deviation from portfolio A is 5%, while the standard deviation from portfolio B is 10%.
Also Read: Security Market Line
We calculate the expected return on portfolio A as follows:
E (R)A= 4 + 5 {(16- 4)/8}
= 4 + 5 (1.5)
=11.5%
Similarly, we will calculate the expected return of portfolio B as follows:
E (R)B= 4 + 10{(16 -4)/8}
= 4 +10(1.5)
=19%
Therefore, we see that with the increase along the capital market line, or with the increase in risk as measured by the standard deviation, the expected returns also increase, and vice versa. Expected returns decrease as the risk or standard deviation decreases.
What are the components of the Capital Market Line?
Slope
As described above, CML assumes that the entire risk portfolio is the market portfolio. Therefore, the slope of the CML is the Sharpe Ratio of the portfolio. The measure of the return of a financial portfolio adjusted to the risk is Sharpe Ratio. Therefore, a higher Sharpe Ratio means a better portfolio and vice versa. If the Sharpe Ratio is above the capital market line, an investor should buy or invest more in that asset. He should sell or lower his investment in the asset if the Sharpe Ratio is below the capital market line.
The Efficient Frontier
The efficient frontier depicts a combination of risky assets. An optimal combination of a set of portfolios that offer the lowest risk for a given return or the highest return for a given amount of risk is the efficient frontier. A line that is drawn tangentially to the Efficient Frontier from the rate of return that is risk-free is the capital market line. The most efficient portfolio will be that formed at the point of the tangent of the CML and the Efficient Frontier.
The CML and the Efficient Frontier are similar, but the main difference between the two is that the former consists not only of risky investments but also of risk-free investments.
Also Read: SML vs CAL
What are the limitations of Capital Market Line?
There are a number of capital-market line assumptions that are flawed and do not hold up in the real world.
Presence of friction
There is always some friction in the market, no matter how little.
Taxes and transaction costs
An investor has to pay taxes and transaction costs for investment transactions. Moreover, these costs are not universal and can vary from person to person and also in different places.
The difference in investors worldwide
In the real world, there is a lack of a strong form of efficiency in the market, so investors do not have equal and uninhibited access to information. Moreover, CML assumes that all investors will behave rationally, which is not always necessary. Furthermore, it is not necessary for all investors to behave rationally, and they may not be risk-averse. Therefore, they may behave differently and take different amounts of risk in their investments.
Ignores different types of risks
The line only considers the standard deviation as a measure of risk. In reality, however, there may also be a number of other risks: inflation risk, currency risk, reinvestment risk, etc. The results without taking these risks into account may therefore be misleading.
Absence of risk-free asset
The concept is based on the principle of the presence of risk-free assets alongside risky assets. In the real world, there is hardly any risk-free asset. However, all types of investments always involve negligible risk.
The flaw in risk-free rates
The concept is also based on the assumption that investors have unlimited access to borrowings or deposits at a risk-free interest rate. In reality, however, a person receives a lower rate if he tries to lend than what he will have to pay at the time of borrowing.
