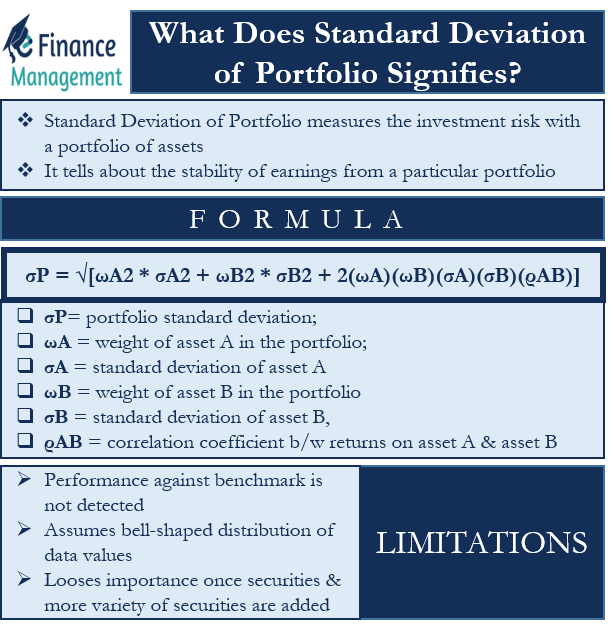
Standard Deviation of Portfolio measures the investment risk with a portfolio of assets. Or we can also say it tells about the income variations in investments and the consistency of the return. Talking about what does standard deviation of a portfolio signifies, we can say that it tells about the stability of earnings from a particular portfolio.
We can calculate the standard deviation of a portfolio by taking the square root of the variance. The variance, in simple words, is the difference from the mean. The general rule is that a portfolio with a high standard deviation suggests a high risk. It indicates that the return from the portfolio is highly unstable and volatile.
There could be several factors – both controllable and uncontrollable – that can impact the portfolio risk. Factors such as inflation, interest rates, unemployment, etc., are uncontrollable factors. And factors including research and development, suppliers’ bargaining power, etc., are controllable factors.
What Does Standard Deviation of Portfolio Signifies?
Investment analysts use standard deviation to analyze the risk with a mutual fund or a hedge fund. Analyzing the portfolio’s standard deviation helps analysts to understand the consistency of return over time.
For instance, a mutual fund that has provided consistent returns in the past will exhibit a low standard deviation. Similarly, a fund focusing on the emerging market is likely to be volatile and, thus, would have a higher standard deviation.
The standard deviation of a portfolio also assists in matching an investor’s risk appetite with the portfolio’s risk level. This is because the standard deviation tells about the total risk, including the systematic and Unsystematic Risks.
Example: What Does Standard Deviation of Portfolio Signifies?
To further answer the question – What Does Standard Deviation of Portfolio Signifies? Let’s consider a simple example.
Mr. X has $2,000 that he invests in two stocks – X and Y. He invests 50% in X and 50% in Y.
Suppose returns from A and B are 7% and 15%, respectively, and the standard deviation is 10% and 20%, respectively. Also, suppose the correlation coefficient between returns of A and B is 0.6. (Diversification will only lead to a drop in risk if there is no perfect correlation between the returns of different assets).
So, to find whether or not an investment in two stocks helped Mr. X to reduce the risk, we need to find the portfolio standard deviation.
Also Read: Value at Risk (VAR) – All You Need To Know
In the case of two assets, the formula to calculate the portfolio standard deviation is:
σP = √[ωA2 * σA2 + ωB2 * σB2 + 2(ωA)(ωB)(σA)(σB)(ρAB)]
Here, σP is portfolio standard deviation; ωA is the weight of asset A in the portfolio; σA is the standard deviation of asset A; ωB is the weight of asset B in the portfolio; σB is the standard deviation of asset B, and ρAB is the correlation coefficient between returns on asset A and asset B.
Now, let’s put the values in the formula:
σP = √[(50%)2 * (10%)2 + (50%)2 * (20%)2 + 2(50%)(50%)(10%)(20%)(0.6)]
So, we get the portfolio standard deviation as 13.6%.
Since the portfolio standard deviation is less than the average individual standard deviation (15%), we can say that the diversification helped Mr. X to reduce the portfolio risk.

Limitations of Standard Deviation
Standard deviation is an important measure of portfolio risk, but it is not a complete tool. It means that standard deviation only tells about the consistency of the portfolio return. Or, we can say it doesn’t tell how well a portfolio performs against a benchmark (Beta measures this).
Another limitation of the standard deviation is that it assumes a bell-shaped distribution of data values. It implies the same probability for the values above or below the mean. So, such a feature sort of blurs the real picture.
Additionally, the standard deviation starts to lose its importance in a portfolio as more securities and more variety of securities are added. Also, the standard deviation value is more accurate if we have large data sets. For example, a standard deviation value based on 50 data points is more reliable than based on five data points.
Final Words
Though standard deviation says a lot about a portfolio, an investor must not solely rely on it. For example, a portfolio that regularly returns between 4% to 5% will have a lower standard deviation than a portfolio that returns between 5% to 10%. This, however, doesn’t make the first portfolio better. An investor must always remember that standard deviation only suggests the dispersion of returns. So, it doesn’t necessarily suggest the future consistency of the returns.

