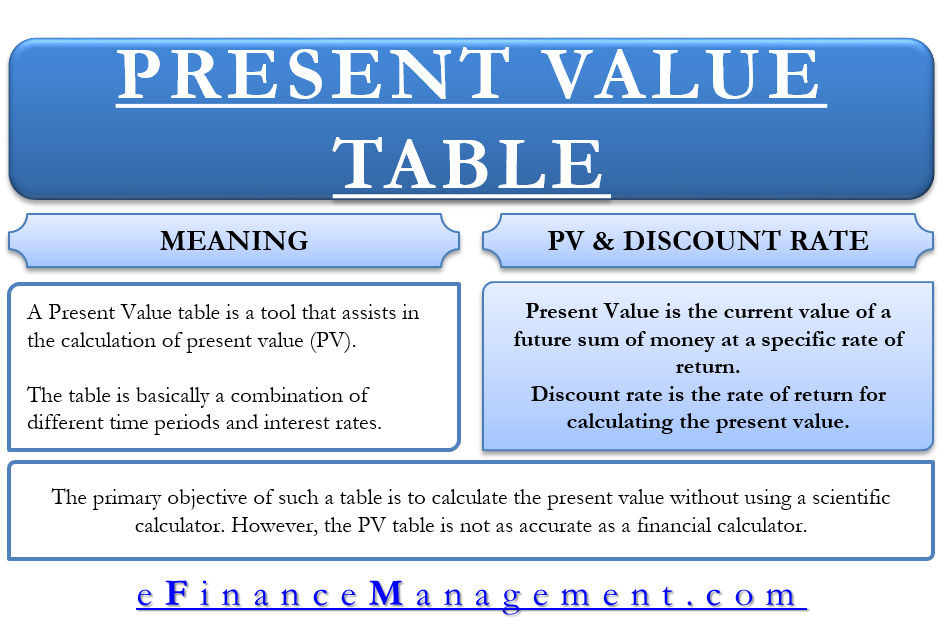
A Present Value table is a tool that assists in the calculation of present value (PV). To get the present value, we multiply the amount for which the present value has to be calculated with the required coefficient on the table. A present value table includes different coefficients depending on the discount rate and the period.
Many also call the PV table as Present Value of 1 Table, as it shows the value of 1 now at the end of n period and % discount rate. So, the table is a combination of different periods and interest rates.

What is Present Value and Discount Rate?
To understand the present value, we will first have to know what is Present Value and Discount Rate are.
Present Value is the current value of a future sum of money at a specific rate of return. To put it simply, money not spent today may lose value in the future owing to the inflation rate, or the rate of return has the money been invested. So, the present value concept suggests that money is worth more now than in the future.
A discount rate is the rate of return for calculating the present value. In simple words, it is the rate of return that an investor forgoes by accepting an amount in the future. So, the discount rate is the expected return that an investor would have got if he had invested the current amount of money for some time.
Also Read: PVIFA Calculator
Value for calculating the present value is PV = FV* [1/ (1 + i)^n]. Here i is the discount rate, and n is the period. Note that the PV table represents the part of the PV formula in bold above [1/ (1 + i)^n]. Many also call it a present value factor.
For example, we need to calculate the PV of $1000 at a 5% discount rate over two years. Putting the values in the formula, $1000*[1/(1+5%)^2] or $1000*0.907 or $907. Here 0.907 is the coefficient.
PV Table – How to Use it?
A present value table or a PV table lists different periods in the first row and different discount rates in the first column. So, the table provides present value coefficients for a given discount rate and time. In the table, the time can be in weeks, months, or years. The discount rates are usually within 0% to 20%, with an interval of 0.25% or 0.50% or 1%.
For example, a company plans to sell its assets whose current price is $2000. The other party is willing to give $2200, but a year later. To decide whether or not to accept the offer, the company will have to calculate the present value of $2200. The company considers a discount rate of 4%. In the sample present value table at, the coefficient of 4% for one year is 0.9615.
Also Read: Net Present Value (NPV)
Now, multiplying this coefficient with the $2200 gives us the present value of $2115. Since the present value of $2200 is more than the current value of the asset, it is profitable to sell the asset.
Also, read – Present Value of Uneven Cash Flows
What’s the Need of a Present Value Table?
The primary objective of such a table is to calculate the present value without using a scientific calculator. However, the PV table is not as accurate as a financial calculator. The table usually rounds the coefficients to the fourth decimal place, while the calculator does not do any such thing. So, this may result in rounding errors when calculating the present value using the present value table.
Continue reading – Present Value of Annuity.

