Meaning
Mean reversion is one of the trading strategies in financial markets that use technical analysis. It is a financial theory that states that asset prices tend to return to their average after an extreme price move, either upwards or downwards. It is one of the most famous trend reversal patterns in technical analysis. Although it is not a guarantee that the price of the asset will revert back to its mean. There is also a possibility that the new price level of an asset may sustain and the mean price eventually moves to the new price level.
The main idea behind mean reversion is that extreme price movements are difficult to sustain for an extended period and return back to their general price level. This theory can be applied to both buying and selling to capitalize on price movements to make a profit. Mean reversion is generally applied when the prices of assets are volatile in nature.
Mean Reversion Indicators
The first step in the mean reversion strategy is to calculate the mean price of an asset. Mean is the average price of the asset over a given period of time. The mean is generally calculated by the simple mean average (SMA) method. SMA is used because traders believe that assets have a tendency to oscillate around the average price over time.
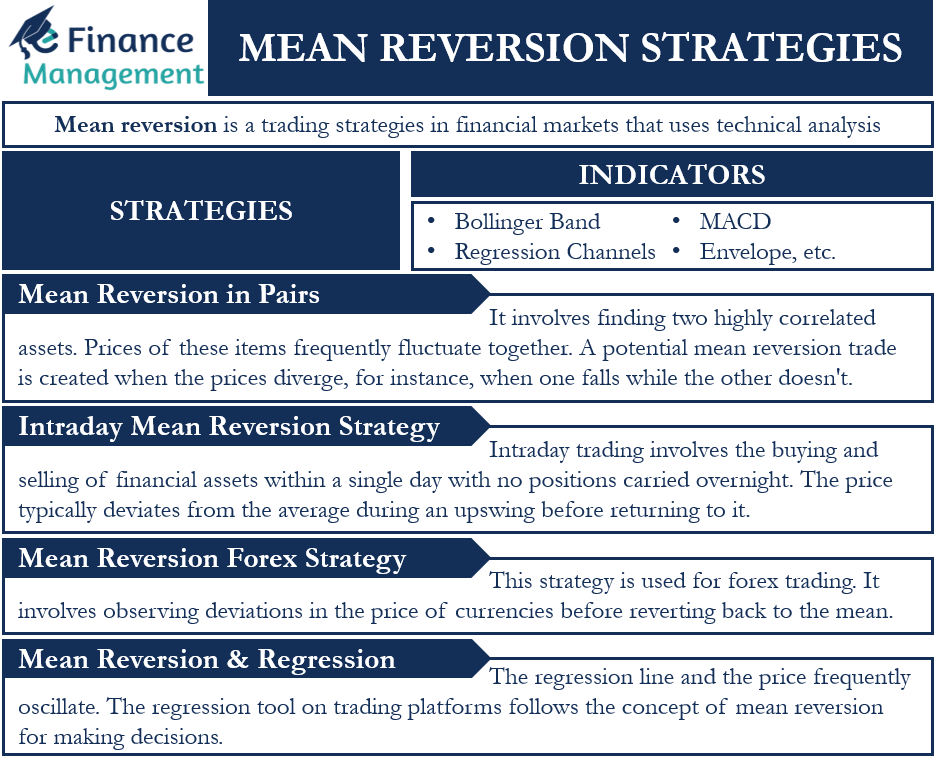
Traders can use several technical indicators such as Bollinger Band, Regression Channels, MACD, Envelope, etc. Each indicator, along with the SMA has its own method for the calculation of asset prices during trading. These indicators attempt to notify traders when the price of an asset is near extreme levels and may revert to its mean. However, indicators only attempt to provide signals and not a clear indication of a reversal in asset price.
Strategies of Mean Reversion
Mean reversion techniques look to profit as an asset’s price reverts to average, or more typical, values. The following are some of the famous examples of mean reversion strategies:

Mean Reversion in Pairs
Pairs trading involves finding two highly correlated assets. Prices of these items frequently fluctuate together. A potential mean reversion trade is created when the prices diverge, for instance, when one falls while the other doesn’t. A pair’s trade requires buying and selling at the same time. It does not matter to a pairs trader which asset rises or falls; they are simply betting that the two prices will converge back to each other and start moving in alignment again.
Intraday Mean Reversion Strategy
Intraday trading involves the buying and selling of financial assets within a single day with no positions carried overnight. The price typically deviates from the average during an upswing before returning to it. When the price returns to the average, this can be a good time to buy and vice-versa in case of a downtrend. Hence, this strategy is generally used based on the market sentiment of a particular day.
Mean Reversion Forex Strategy
This strategy is used for forex trading. It involves observing deviations in the price of currencies before reverting back to the mean. Traders may enter a short position if the price of an asset rises above a common reversal level on an indicator, and then drops below that level. A target is placed at the mean and stop loss is added to avoid loss. The same concept is applied to long positions when the price dips below the common reversal pattern.
Mean Reversion and Regression
A regression line displays a solitary line that most closely matches a chosen price series. The regression line and the price frequently oscillate. The regression tool on trading platforms follows the concept of mean reversion for making decisions. A regression is simply another way of measuring what normal looks like. The regression line highlights the dominant price trend, and the price of an asset tends to move around it. The regression line makes it easier to identify extreme price movements and make trading decisions as per mean reversion.

