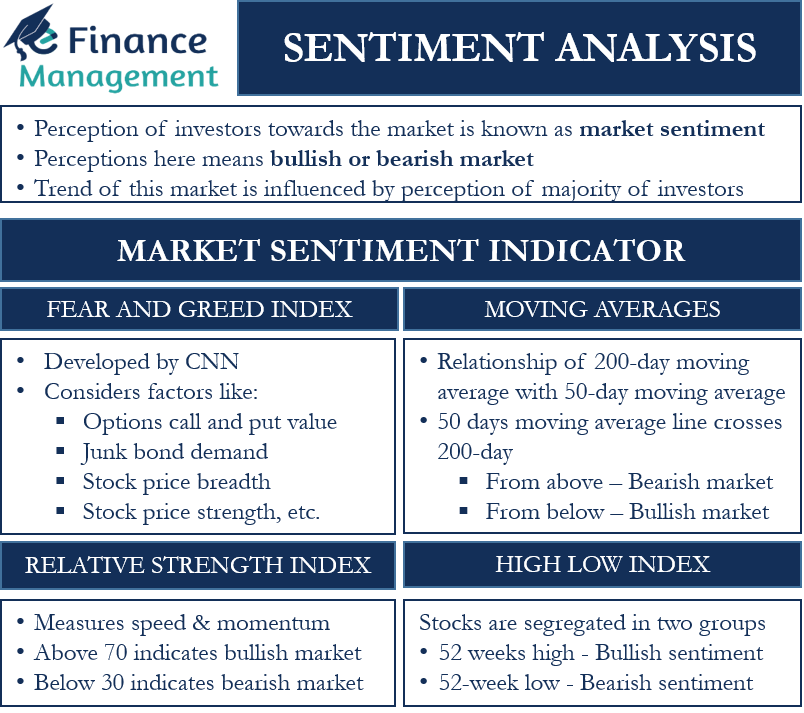
To begin with, we need to first understand what we mean by market sentiment. In layman’s language, it is the attitude or perception of investors towards the market. In other words, it is ‘what the investors think of the market.’ For example, whether the market is bullish, i.e., prices are increasing on a regular basis, or bearish (decreasing prices). Perception or psychology of the investors in the market.
Market sentiment does not always match the fundamental value of the stock. Emotions drive investors’ way of thinking. If the investors set high expectations on a stock, they will continue to buy the shares, driving the price up. Fundamentally the increased price may not carry any justifications. But the emotions and expectations of the investors will decide the fate of the stock. Therefore, if a large number of investors have a similar perception or sentiment about the market or for that particular stock, the stock will follow that trend only.
Technical analysts study the price and volume of securities which helps us understand the current sentiment and trend of the market.
Market Sentiment Indicator
To understand, one can look out for the common indicators that rule the current market. Indicators are a common way to understand and gauge what the market is thinking in general. And what the market thinks indicates is the perception of the majority of investors. One important thing to note here is that these indicators are not pure science or the ultimate. They vary from region to region, and the market may not behave exactly in the same way because these indicators may not produce the desired results in isolation. Instead, these need to be seen in conjunction with some other references too.
For example, indicators depicting a bullish market are different in US or UK. It primarily depends on the economy. Another point to focus on, what is the perception of the market or investors about these indicators. To understand the prevailing market sentiment, all indicators are looked into. We cannot conclude the market sentiment based on just one indicator or signal.
Moving Averages
Moving Averages is one of the most common indicators in use by many technical analysts. And depending upon the time frame, these moving averages can be as long as 200 days or as short as 5 or 10 days moving averages. Usually, for a mid-term outlook, a comparison and relationship of a 200-day moving average are seen with a 50-day moving average. As per standard practice, if the 50-day moving average line crosses the 200-day moving average from below then, it is an indication of bullish market sentiment. Similarly, if a 50-day moving average plummets below a 200-day average or it crosses the 200-day moving average from the top, it is an indication of a bearish market.
CBOE Volatility Index
CBOE Volatility Index or popularly known as the VIX was founded by the Chicago Board Options Exchange. It quantifies the market sentiment or emotions of the investors. To assess the volatility, analysts usually use standard deviation. And that helps us to know the sensitivity and risk of the security. VIX measures the fear of investors; when the market falls, VIX surges, and so does the fear of the investors. Similarly, when the market advances, VIX and fear decrease.

Relative Strength Index
Another indicator commonly in use by analysts is the RSI or Relative Strength Index. It measures the speed and momentum of stock prices in technical analysis. RSI index oscillates between 0 to 100. An RSI above 70 indicates an overbought market situation, i.e., the market is bullish. Whereas an RSI score below 30 indicates an oversold market showcasing a bearish market situation. RSI is one of the useful measures in understanding the sentiment of the market or industry.
A High Low Index
Stocks are segregated into two groups, companies that are recording 52 weeks high and the firms recording a 52-week low. A high low index above 50 means more companies are recording a 52-week high, indicating a bullish sentiment is prevailing in the market. In contrast, a high low index below 50 shows more companies are recording 52-week lows. And that signals a bearish market sentiment.
The Fear and Greed Index
CNN developed the fear and greed index. This index considers various factors in gauging the sentiment of the market. These are Options call and put value, junk bond demand, stock price breadth, stock price strength, etc.
Conclusion
Many organizations develop indicators that summarize the overall sentiment in the market. The point to note here is that these indicators suggest and indicate the general and overall perception and attitude of the investors. As we know, the market operates on the basic premise that there is always a difference of opinion between the sellers and buyers with regard to the stock prices. Then only transactions can happen, one can buy, and the other one can sell. Hence, there are contrarians in the market that views the current trend and stock prices not only from a purely technical angle. They associate this with stock fundamentals and eyes profits using a contrarian strategy.
RELATED POSTS
- Bullish And Bearish – Meaning, Relevance And More
- Fear and Greed Index – Meaning, Pros, Cons, Use, and Factors
- High Low Index or Breadth Indicator
- CBOE Volatility Index – Meaning, Calculation, and Interpretation
- Bull Market vs Bear Market – All You Need To Know
- Fundamental vs Technical Analysis – All You Need to Know

