Value at risk (also VAR or VaR) is the statistical measure of risk. It quantifies the value of risk to give a maximum possible loss for a company or a stock, or a portfolio. VAR, which was developed in the late 90s by JPMorgan, uses price movements, historical data on risk, and volatility for calculation.
We can say that this measure gives the potential loss for any type of investment over a time period. Basically, it provides the probability of losing a given amount for any investment. VAR usually has three elements – an estimate of the loss, a time period, and a confidence level.
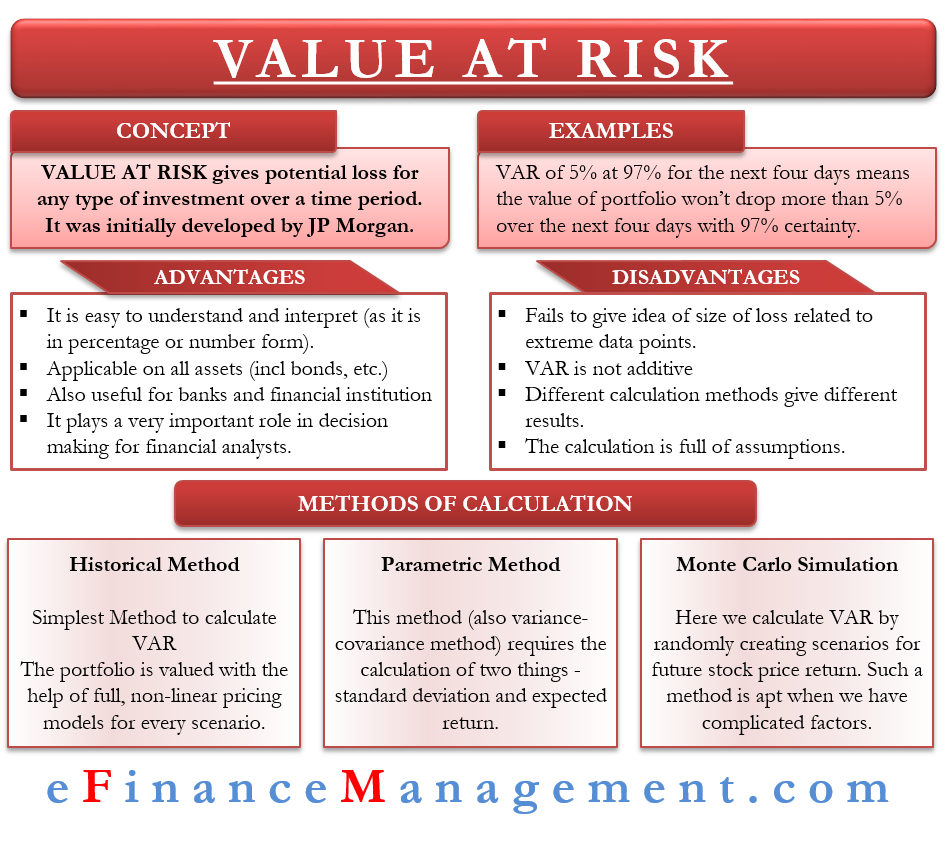
For example, a VAR of 5% at 97% for the next four days means the value of the portfolio won’t drop more than 5% over the next four days with 97% certainty.
Who Uses It and Why?
Risk managers usually use this to measure the risk and then take appropriate actions to bring the risk below the acceptable limit. Also, banks and other financial institutions use it to ascertain the extent and occurrence ratio of losses they could incur.
To banks and other financial institutions, this helps to ensure that they have enough capital reserves to cover the losses. Or if they need to reduce concentrated holdings to take on higher-than-acceptable risks.
Advantages
Following are the advantage of value at risk:
- VAR value is a single digit, either as a percentage or in dollar terms. This makes it easy to understand and interpret.
- One can apply it to all types of assets, including shares, bonds, currencies, derivatives, and more.
- Banks and financial institutions can use this statistical measure to ascertain the risk in different investments and then allocate risk on the basis of VAR.
- Finance experts use this measure widely. Moreover, it plays an important role in decision-making as well.
Drawbacks
Even though VAR is a pretty useful statistical technique, it suffers from a few drawbacks:
- It fails to give an idea of the size of the loss related to the extreme data points or the tail of the probability distribution.
- VAR is not additive. This means the VAR of individual stocks does not equal to the VAR of the total portfolio. It is because VAR does not consider correlations, and thus, adding may result in double counting.
- There are various methods to calculate VAR, and each method gives a different result.
- Calculating the VAR of a portfolio is a difficult task. One not only has to calculate the risk and return of each security but also correlations among them. So, if a portfolio has a diversity of assets, the task to calculate VAR gets more difficult.
- To calculate VAR, one needs to make a few assumptions. If these assumptions are not valid, then the VAR figure is inaccurate as well.
Methods to Calculate VAR
One can calculate VAR in three ways:
Historical Method
It is the simplest way to calculate VAR. In this, one uses market data for the last 250 days. With the data, one calculates the percentage change for each risk factor on each day. Then current market values are used to calculate the percentage change and get 250 scenarios for future values. After that, the portfolio is valued with the help of full, non-linear pricing models for every scenario. Now, the third-worst is chosen to be 99% VAR.
The formula for VAR under this method is Vm (Vi/Vi-1). Here Vi is the number of variables on day i, and m is the number of days for which the historical data is used.
Basically, this method reorganizes the actual historical return and arranges them from worst to best. Also, it assumes that from the risk perspective, history will repeat.
Parametric Method
The normal distribution in returns is the assumption for this method. This method (also variance-covariance method) requires the calculation of two things – standard deviation and expected return. Both these things help to plot a normal distribution curve. Such a curve helps to easily know the location of the worst 5% and 1% on the curve.
This method is similar to the historical method, but we don’t use actual data, but rather the familiar curve under the parametric method. The parametric method is perfect for scenarios where one can accurately estimate the distributions. On the other hand, it may fail to give clear results if the sample size is small.
Monte Carlo Simulation
Under this, we calculate VAR by randomly creating scenarios for future stock price returns. After that, we calculate the change in the value for each scenario and then calculate VAR as per the worst losses. Such a method is apt when we have complicated factors. This method assumes the probability distribution for risk factors is known.
Other Related Terms
Marginal Value at Risk (MVaR)
MVaR helps to know the change in risk due to any addition or substation of an investment in a portfolio. Suppose an investment has a high VAR but has a negative correlation with the portfolio. In that case, its overall contribution to the portfolio risk may be much lower than its individual risk.
Incremental Value at Risk
Similar to MVaR, it tells the change in risk of VAR. But, unlike MVaR, which measures the change in an investment in a position, Incremental Value at Risk measures the change in risk by adding or removing an entire position in a portfolio.
Conditional Value at Risk (CVaR)
It is basically an extension of the VAR. CVaR or average value at risk or tail VaR allows a user to calculate the average of the losses beyond the VAR point. A general rule is – the smaller the CVaR, the better it is.
Final Words
Overall, VAR is a good measure of risk. The only issue it suffers from is that it ignores tail risks or extreme data points. However, VAR is a useful and accurate measure for general day-to-day activities.
