What is a Variance Analysis Report?
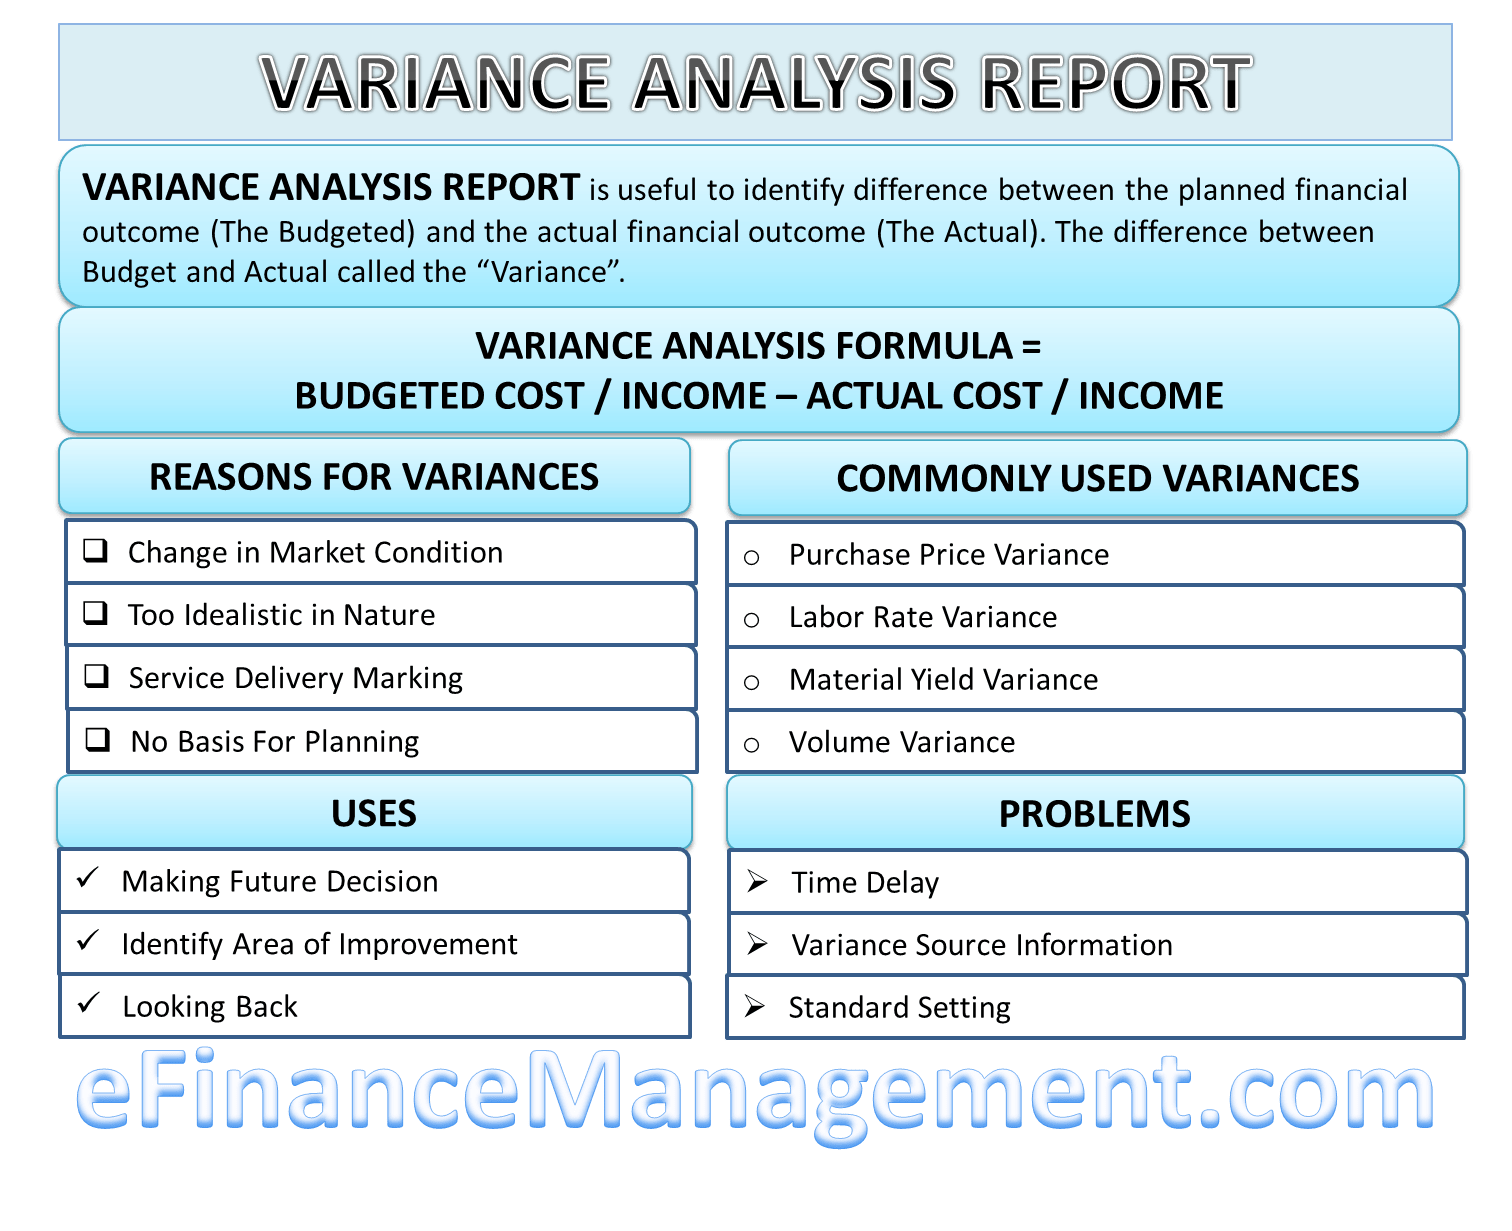
Variance Analysis Report is useful to identify the gap between the planned outcome (The Budgeted) and the actual outcome (The Actual). The gap between Budget and Actual is called the “Variance.”
Explanation with Example
Let’s understand it with a small story for layman’s understanding. Tim and George used to run a manufacturing unit, XYZ Inc. For the year 2019-20, they estimated to achieve $1 M and a 0.8 M amount of revenue and expenses, respectively, to earn a profit of 0.2 M (1-0.8). At the end of the year, Tim prepared a report that stated actual revenues & expenses of 0.91 M and 0.79 M, respectively. Thus, the overall profit achieved is 0.12 M in place of the planned 0.2 M. Since overall things were not in their favor, it calls for a detailed analysis of what went wrong and how to correct them for the next year. Such a report that is equivalent to a performance appraisal of the overall business and an explanation and advice on the future course of action is a “Variance Analysis Report.”

Variance Analysis Formula
A formula for variance analysis is as under:
Variance = Budgeted Cost / Income – Actual Cost / Income
Favorable variance (positive; better than planned)
Adverse variance (negative; worse than planned)
How to Prepare a Variance Analysis Report?
Although, there is no fixed rule for preparing a variance analysis report. The following could be one of the logical sequences of preparing such a report. We continue the same example of the manufacturing unit, XYZ Inc.
Step by Step Method to Prepare
Step 1: Calculation of Variances
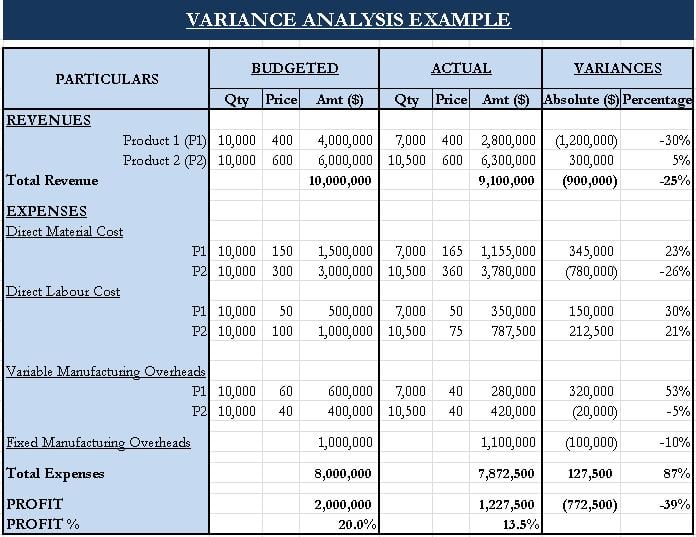
Prepare a table like the following, preferably using a spreadsheet/excel. The table mentioned in the following image mentions detailed information about the revenue, expenses, and the resultant profits. It is appropriate if the product information like quantity and price are also mentioned. On the other side, it contains costing information like variable and fixed costs. These pieces of information can easily be gathered from the organization’s accounting system.
Also Read: Variance Analysis

Step 2: Notes or Explanation to Variances
Notes or explanations to each of the variances that occurred in the business during the period. We have assumed a period of 1 Financial year here, but the CFOs can also prepare it bi-yearly, quarterly, or even monthly, depending on the usefulness of the report.
Calculating variances is not very critical, but understanding, analyzing, and interpreting this information is much more critical for making the whole exercise fruitful. These notes can be further sub-divided into various types of variances, such as the following:
- Material Variance
- Labour Variance
- Variable Overhead Variance
- Fixed Overhead Variance
- Sales Variance
We will not evaluate each one of these here. Let’s take Revenue Variances as an example.
Revenue Variance
We can clearly see there is an overall adverse variance of 0.09 Millon, i.e., 25%. That is said, but that’s not enough. Now, we need to look at why there is an adverse variance. We have 2 products, i.e., P1 and P2. In the product level details, P1 has a significant negative variance of -30%, whereas P2 has a favorable variance of 5%. The first level conclusion that comes to mind is that P1 and its whole team should be blamed. We can still go further and check why P1 had such a variance. Is it due to the lower quantity of sales or lower prices fetched from the market? Looking at the table, we can see that the prices were not compromised, but the overall volumes could not be achieved.
Reasons
On discussing with marketing teams, they can further dig down reasons for such a fall in volumes, and any of the following reasons could come out.
Also Read: Variance Analysis Formula with Example
- Efforts by the marketing team were not up to the mark.
- The market was price-sensitive, and there was a missed opportunity to optimize overall revenues by compromising a bit on prices.
- The quality of the goods was not appropriate.
- The production team did not perform well in producing and supplying to the market demand.
- Etc.
Sample Report of Variance Analysis
MEMO
To: Board of Directors
From: Executive Director, Association for Better Community, Inc.
Date: June 15, 20XX
Subject: Actual vs. Budget Variance Report
| Particulars | Budget | Actual | Variance | Variance |
| 1 Jan to 30 Apr | 1 Jan to 30 Apr | $ | % | |
| Income | ||||
| Govt Grant | 15,000.00 | 20,000.00 | 5,000.00 | 33% |
| Sponsorship | 3,500.00 | 3,750.00 | 250.00 | 7% |
| Other Income | 280.00 | 570.00 | 290.00 | 104% |
| Total | 18,780.00 | 24,320.00 | 5,540.00 | 29.50% |
| Expenditure | ||||
| Promotion | 1,500.00 | 200.00 | 1,300.00 | 87% |
| Purchase | 1,650.00 | 4,700.00 | -3,050.00 | -185% |
| Team Funding | 1,650.00 | – | 1,650.00 | 100% |
| Printing Expense | 1,000.00 | 1,665.00 | -665.00 | -67% |
| Total | 5,800.00 | 6,565.00 | -765.00 | -13.19% |
| Surplus/Deficit | 12,980.00 | 17,755.00 | 4,775.00 | 36.79% |
The variance analysis report also contains an explanation for each variance.
For example,
Purchase expenses are increased due to the lower supply of raw materials used in production.
You can view a sample variance analysis pdf report in the below reference links.
Most Commonly Used Variances
Purchase Price Variance
Purchase price variance results when the actual price paid for materials is more/less than the budgeted cost for such materials.
Labor Rate Variance
Labor rate variance results when the actual price paid as wages is more/less than the budgeted cost for wages. For instance, labor is paid at $ 10 per hour but is paid at $ 12 in actuality.
Material Yield Variance
Material yield variance shows the actual quantity of material used and the standard quantity expected to be used in the course of production, multiplied by the standard cost of such materials.
Volume Variance
Volume variance means actual quantities sold or consumed and the budgeted quantity expected to be consumed or sold multiplied by the standard price per unit.
Reasons For Variances
- Change in market conditions which have rendered the standard budgeting practices unrealistic. e.g., short supply of raw materials causing suppliers to hike prices.
- The budgeting standards followed may be too idealistic in nature. e.g., the output of a machine may be wrongly assumed.
- Service delivery may not be up to the mark. e.g., planning may have taken into account an eight-hour working day. However, actual ground conditions may only allow six hours a day.
- In certain cases, there can be no basis for planning. e.g., the output of creative activities cannot be benchmarked to a high level of accuracy.
Use of Variance Analysis Report
Making Future Decision
Variance analysis report helps management make future decisions like deciding the product’s price. Suppose variance analysis shows that cost cannot be decreased, then management may increase the price of the product.
Identify Area of Improvement
Variance analysis report helps the management identify the area in which a company can improve. So, management can Find ways to decrease costs or increase sales & ultimately help a company increase its business profitability.
Looking Back
Managers use variance analysis to measure and analyze what has already occurred in the company’s activity—understanding what has hindered or helped the company in its actual performance. It helps management decide what policies and procedures should be modified and how.
Problems With Variance Analysis Reporting
Time Delay
Due to the periodical preparation of the variance analysis report, it is not of much use in a fast-paced environment compared to other tools. Therefore the management has to rely on other measurements generated on the spot.
Variance Source Information
Generally, reasons for variance are not recorded in financial records. Thus the management has to identify reasons from different sources such as bills of material and overtime records to determine the cause of the problems. Hence the source of information is important.
Standard Setting
Variance analysis is essentially a comparison of actual results to an arbitrary standard that may have been derived from political bargaining. Consequently, the resulting variance may not yield any useful information.


Awesome guide, thoroughly explained. It’s a great .
Variance Analysis has been explained in simple terms to understand….quite useful!!!