What is Cost Pool?
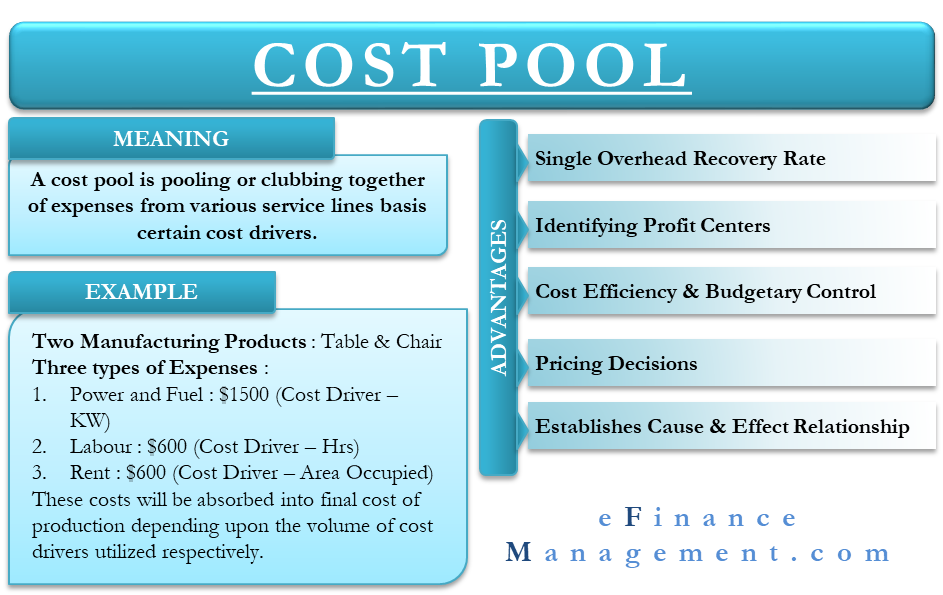
A cost pool is pooling or clubbing together of expenses from various service lines basis certain cost drivers. These pools are further allocated to products or services depending upon the underlying usage of the relevant cost drivers.
The guiding principle behind the cost pool is to attribute indirect costs to certain cost drivers. This, in turn, helps allocate all overhead costs to the final product or service using a segregation mechanism.
The jargon may sound intimidating. However, ABC costing is the crispest and most accurate method for cost allocation. Consider the below over-simplified example to explain the concept for further clarity.
Consider a business manufacturing two products- Tables & Chairs
There are broadly three types of expenses incurred:
| Amount in $ | Cost Driver | |
| Power & Fuel | 1500 | Kilo Watts Consumed |
| Labor | 600 | No of Hours |
| Rent | 600 | Area Occupied |
| Total | 2700 |
These costs are then clubbed to form a cost pool of the final product. The cost pool is the determined basis of cost drivers. Cost drivers are nothing but units of activity. These units have a direct impact on the cost under question. For example, labor cost is directly affected by the labor hours worked (unit of activity).
Also Read: Cost Hierarchy – Meaning, Levels and Example
These costs will be absorbed into the final cost of production depending upon the volume of cost drivers utilized respectively.
Advantages of Using Cost Pool
Single Overhead Recovery Rate
Every cost pool enlists the overhead amount to be absorbed basis the level of activity. Also, it is a level above the traditional costing system where overheads are absorbed at an overall factory level. A pool enables viewing the overhead rate for every department and service line individually. This, in turn, enables computation of the overhead rate for every product manufactured. Thus, a cost pool makes it possible to view overhead recovery rates from multiple angles of the department and production.
Identifying Profit Centers
The cost pool enables a view of overhead absorption at the department and the product level. It, therefore, becomes a matter of simple comparison against corresponding revenue to ascertain the extent of profitability generated by every individual product manufactured. Since a cost pool causes the overheads to be dissected to the hair, it provides the most accurate picture of product profitability.
Cost Efficiency & Budgetary Control
The management can have a view of the expenditure incurred at every cut. A department that may seem to be working efficiently may be weighing the heaviest as a cost component in the final product. Alternatively, a product being produced at the budgeted costs may still have scope for cost reduction owing to departmental inefficiencies waiting to be smoothed out.
Pricing Decisions
Having a pre-determined cost pool and computed recovery rates at hand enables management to maintain flexibility when it comes to pricing decisions. A breakup of the overall cost of production to the T makes known to the management exactly how much room it has to maneuver when it comes to setting prices. Having such a detailed cost breakup makes businesses more confident in responding to market forces and tackling competition.
Establishes Cause & Effect Relationship
As discussed, a cost pool is an accumulation of all departmental and indirect costs as going into the making of the final product. This one on one mapping of the intermediary to the finished stage of production draws a clear thread as to what goes into the manufacture of the output. This information is useful in determining the service lines on which the output is most heavily dependent and vice versa. It also brings out the extent of consumption, thus drawing the attention of management to most emergent areas when required.
Cost Pool Explained with Illustration
Consider a plant manufacturing 3 products- X, Y & Z.
Given total overhead costs for the period amount to $750,000 and total machine run time is 2500 hours divided equally among all three products.
On analysis, the overheads could be broken down as below mentioned:
| Costs relating to set-ups | 40% |
| Costs relating to materials handling | 10% |
| Costs relating to machinery | 30% |
| Costs relating to inspection | 20% |
| Total production overhead | 100% |
Activities for the Period:
| Number of Set-Ups | No of Material Movement | No of Inspections | |
| Product X | 75 | 12 | 150 |
| Product Y | 115 | 21 | 180 |
| Product Z | 480 | 87 | 670 |
| 670 | 120 | 1000 |
Now, to allocate all costs to a product pool, the cost driver rates must be computed. The working is as below:
| Set Up Cost | Machine Cost | Material Handling Cost | Inspection Expense | Total | |
| 40% | 30% | 20% | 10% | 100% | |
| Overhead Allocated ($) | 300,000 | 225,000 | 150,000 | 75,000 | 750,000 |
| Cost Driver | Number of Set Ups | Machine Hours | No of Material Movements | Count of Inspections | |
| Rate per Driver | 447.76 | 90 | 1250 | 75 | |
| (300,00/670) | (225,00/2500) | (150,000/120) | (75,000/1000) |
Therefore, the computed cost pool for each product is as follows:
| Product X | Total Cost Pool | (Activity X Rate per Driver) |
| Set Up Cost. | 33,582 | (75 X 447.76) |
| Machine Cost. | 75,000 | (833 X 90) |
| Material Handling Cost. | 15,000 | (12 X 1250) |
| Inspection Expense. | 11,250 | (150 X 75) |
| Total Cost Pool | 134,832 | |
| Similarly, for Y & Z | ||
| Y | Z | |
| Set Up Cost | 51,405 | 214,925 |
| Machine Cost | 75,000 | 75,000 |
| Material Handling Cost | 26,250 | 108,750 |
| Inspection Expense | 13,500 | 50,250 |
| Total Cost Pool | 166,155 | 448,925 |
Also, read Costing Terms to learn more about various other basic terms of costing.
