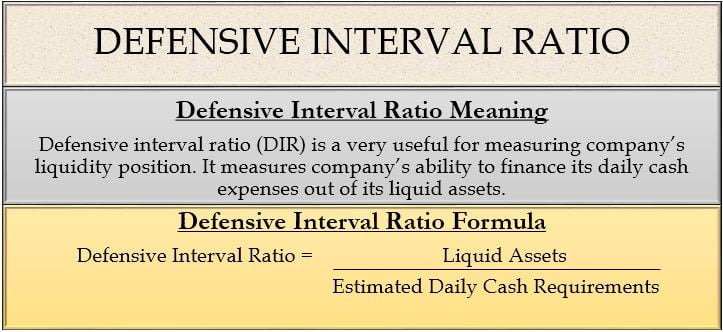
Defensive Interval Ratio (DIR): Meaning
A defensive interval ratio (DIR) is a very useful liquidity ratio for measuring a company’s liquidity position. It measures a company’s ability to finance its daily cash expenses out of its liquid assets. In simple language, it estimates the number of days a company can survive its day-to-day operations with its liquid assets. Or, we can also say that this helps in estimating the interval measures of the company. As long as the company can survive on liquid assets for paying cash expenses, it will not have to depend on fixed assets or external sources of finance.
Defensive Interval Ratio (DIR): Formula
The formula to calculate defensive interval ratio is as follows:
| Defensive Interval Ratio = Liquid Assets / Daily Operating Expenses |
- Liquid assets are also known as quick current assets. Current assets include some illiquid assets like inventory and prepaid expenses. Including these illiquid assets in the calculation will not provide a perfect picture of the company’s liquidity. Hence, DIR only includes assets with high liquidity.
- Daily operating expense: It means the estimated daily cash requirements of the business to operate smoothly.

Example of Defensive Interval Ratio
| Description | Company X |
| Cash | $ 900,000 |
| Marketable Securities | $ 200,000 |
| Account Receivables | $ 300,000 |
| Liquid Assets (A) | $ 1,400,000 |
| Annual Cash Operating Expense (B) | $ 7,300,000 |
| Estimated Daily Cash Requirements (C) = (B)/365 | $ 20,000 |
| Defensive Interval Ratio = (A)/(C) | 70 Days |
Interpretation of Defensive Interval Ratio (DIR)
Company X has a DIR of 70 days. It means that Company X will have sufficient funds through liquid assets to pay its cash expenses for 70 days. The higher the DIR, the better the liquidity of the firm. High DIR is a positive signal because the company is able to take care of its cash requirements from internal sources. It creates a buffer period for the company as arranging funds through other sources will be time-consuming.
To analyze company X on the basis of the defensive interval ratio, consider the following details:
| Description | Defensive Interval Ratio |
|---|---|
| Company Y | 55 Days |
| Industry Average | 90 Days |
There is nothing like an ideal number for DIR. It changes from industry to industry. Analysts use it in comparative analysis. A company’s DIR is compared with another company of similar nature and industry average. In the above example, Company X is considered better than Company Y because Company X has a DIR of 70 days compared to Company Y’s DIR of 55 days. But, company X’s DIR is lower than the industry average, which is a concern. Therefore, company X will have to accelerate the cash inflows or arrange other sources of cash.
Uses of Defensive Interval Ratio
The following are the uses of the DIR:
- It helps in evaluating a company’s liquidity position and its ability to finance its daily cash expenses out of its liquid assets.
- DIR is used internally by the company itself. The company compares past DIRs with recent DIRs to gauge an idea about its liquidity position. If DIR is increasing, then liquidity is improving, and vice versa.
- A company can also use the defensive interval ratio to compare itself with other companies in the same industry.
- DIR also helps in analyzing the credit risk associated with a company defaulting on short-term obligations.
- Some cyclical industries have a higher requirement of cash during some specific period. DIR can be useful for such industries. It helps in planning the sources from which the capital requirements will be taken care of after liquid assets are fully utilized.
Issues with Defensive Interval Ratio
There are some drawbacks of the defensive interval ratio too. Estimating the cash required on a daily basis is a complex task. Some days a company might require a large amount of cash, i.e., large payments to suppliers or employees. Some days the amount of cash required is not so significant. This irregularity makes DIR a less accurate measure.
Also, the data used for calculating liquid assets is affected by many other factors. Cash and account receivable keep changing with new transactions throughout the year. Hence, this ratio should be used cautiously; otherwise, it might not reflect the company’s economic reality.
Learn more about other types of LIQUIDITY RATIOS.

