What is Vertical Analysis?
Vertical analysis is one of the financial statement analysis methods. It is also known as the common-size financial statement analysis. A common-size financial statement expresses every item in the financial statement as a percentage of one convenient base parameter. The base item for the common size balance sheet is taken as the total assets (for the assets side) and total liabilities (for the liabilities side). While for the common size income statement (profit and loss statement), the base parameter is taken as sales or revenue.
Formula for Vertical Analysis
The formula for calculating common size ratios under the vertical analysis method or common-size analysis method is as follows:
- What is Vertical Analysis?
- Formula for Vertical Analysis
- Use of Common-Size Financial Statements
- Advantages of Vertical Analysis/Common-size Financial Analysis
- Disadvantages of Vertical Analysis/Common-size Financial Analysis
- Vertical Analysis of Financial Statements
- How it is Different from Horizontal Analysis?
- Can’t Answer ‘Why.’
| Common Size Ratio = (Concerned Parameter / Base Parameter) * 100 |
The above-mentioned is a general formula for vertical analysis. The specific formula for the common-size balance sheet and income statement is as follows:
| Common-size Balance Sheet = (Concerned Item of Balance Sheet/Total Assets or Liabilities) * 100 |
| Common-size Income Statement = (Concerned Item of Income Statement/Total Sales) * 100 |
Use of Common-Size Financial Statements
Following are the uses of common-size financial statements (vertical analysis):
Comparing Two Companies
Common-size ratios help compare two companies that differ in size. By expressing all the parameters in terms of the percentage of sales or assets, they can remove bias. One can use common size ratios to benchmark the company against the best in the business. This will help evaluate where the business stands on various parameters against competitors.
Comparing Two Periods
Common-size financial statements can also be used to evaluate a company’s performance over different periods of time. One can evaluate what percentage of sales was the cost of goods sold 5 years before compared to the current figure. This can present a fair idea of how the company has fared in respect of various years.
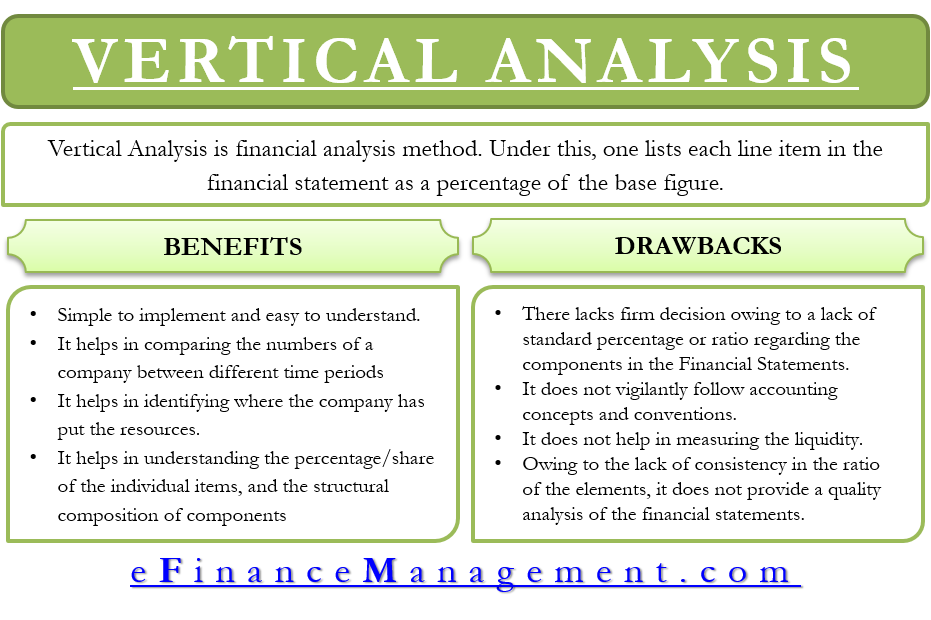
Advantages of Vertical Analysis/Common-size Financial Analysis
The following are the pros of common-size financial statements or vertical analysis
- It is simple to implement and easy to understand.
- Also, this method makes it easier to compare one company’s performance (even for each line item) against another.
- It also helps compare the financial figures of a company between different time periods, be it quarterly, half-yearly, or annually. For instance, by expressing the expenses of each year in the income statement as a percentage of sales, one can analyze if there is any reduction or whether the profitability is improving. Thus, it also helps in keeping a check on expenses.
- Such a technique also helps identify where the company has put the resources. And, in what proportions have those resources been distributed among the balance sheet and income statement? Moreover, the analysis also helps determine the relative weight of each account and its share in revenue generation.
- The vertical or common-size financial analysis also helps understand the percentage/share of the individual items and the structural composition of components, such as assets, liabilities, and expenses.
- Additionally, it not only helps spot spikes but also determines expenses that are small enough for management not to focus on them.
Disadvantages of Vertical Analysis/Common-size Financial Analysis
The following are the cons of vertical analysis or common-size financial statements.
- Different firms may adopt different accounting practices. In that case, the common ratios may not be directly comparable. This requires adjustments to be made in order to compare the common ratios.
- It does not help make a firm decision owing to a lack of standard percentage or ratio regarding the components in the balance sheet and income statement.
- Owing to the lack of consistency in the ratio of the elements, it does not provide a qualitative analysis of the financial statements.
Vertical Analysis of Financial Statements
Let us look at some examples to learn about the vertical analysis of financial statements
Common-size Income Statement
Commonly, the vertical analysis of the income statement expresses line items as a percentage of sales. However, one can also use it to show the percentage of different revenue items that make up total sales. Following is an example of vertical analysis for an income statement:
| Particulars | Amount ($) | Percentage (%) |
|---|---|---|
| Sales | 1,000,000 | 100% |
| Cost of Goods Sold | 400,000 | 40% |
| Utilities | 100,000 | 10% |
| Gross Margin | 500,000 | 50% |
| Salary | 250,000 | 25% |
| Office Rent | 50,000 | 5% |
| Admin & Selling Expenses | 30,000 | 3% |
| Net Profit | 170,000 | 17% |
Common-size Balance Sheet
In the vertical analysis of a balance sheet, a major question is what to use as a denominator. Usually, it is the total asset, but one also can use total liabilities for calculating the percentage of all liability line items. We can use a total of all equity accounts for the equity line item. Such an analysis helps evaluate the changes in the working capital and fixed assets over time. Investigating these changes could help an analyst know if the company is shifting to a different business model.
Following is an example of vertical analysis of the asset side of a balance sheet where each line item is a percentage of total assets:
| Particulars | Amount ($) | Percentage (%) |
|---|---|---|
| Fixed Assets | 400,000 | 40% |
| Account Receivable | 350,000 | 35% |
| Inventory | 150,000 | 15% |
| Total Current Assets | 600,000 | 60% |
| Cash | 100,000 | 10% |
| Total Assets | 1,000,000 | 100% |
How it is Different from Horizontal Analysis?
Horizontal analysis method looks at the financial performance over a horizon of many years. Under horizontal analysis, one shows the amounts of past financial statements as a percentage of the amount from the base year. For instance, year one is taken as the base over five years, and the amount of all other years is expressed as a percentage of the base year. On the other hand in vertical analysis, either the sales/revenue or total asset/total liabilities of the same year is taken as the base parameter to express the performance in terms of percentage. Let’s see an example of horizontal analysis to get understand it well.
| Year | Selling Expenses($) | Selling Expenses(%) |
| 2000 | 5000 | (5000-5000)/5000*100 = 0% |
| 2001 | 5800 | (5800-5000)/5000*100 = 16% |
| 2002 | 6000 | (6000-5000)/5000*100 = 20% |
| 2003 | 6600 | (6600-5000)/5000*100 = 32% |
| 2004 | 7100 | (7100-5000)/5000*100 = 42% |
In the above example, the year 2000 is taken as the base year to know about the selling expenses for the past 5 years. Similarly, we can check for the trend for a particular expense or income and which helps in particular income helps to increase profit or which expenses are responsible for a decrease in profit. Horizontal Analysis helps to identify the trend more easily. The example above clearly shows that the selling expenses of a firm have increased each year.
Also Read: Objectives of Financial Statement Analysis
| Basis | Horizontal Analysis | Verticle Analysis |
|---|---|---|
| Timeframe | Analysis of financial performance over multiple years | Analysis of financial performance for a single year |
| Base Year | One of the years is taken as the base year | A single year’s sales/revenue or total asset/total liabilities is taken as the base parameter |
| Method | Financial statements for each year are compared to the base year | A single year’s sales/revenue or total assets/total liabilities is taken as the base parameter |
| Parameter | Financial statements (income statement and balance sheet) | Sales/Revenue or Total Asset/Total Liabilities |
Can’t Answer ‘Why.’
We have already covered the disadvantages of vertical analysis, but a major drawback of vertical analysis is that it does not answer why there are deviations. Look at the table below:
| Particulars | Year 1 | Year 2 | Year 3 |
|---|---|---|---|
| Sales | 100% | 100% | 100% |
| COGS | 30% | 29% | 40% |
| Gross Profit | 70% | 71% | 60% |
| Marketing | 5% | 5% | 10% |
In the above table, we see that COGS (Cost of Goods Sold) for the company spiked in year three. Such a spike leads to a significant drop in gross profits. The reason for such a drop could be the higher cost of production or the drop in the price as well. Though the example shows an increase in the COGS, we can’t be sure unless management confirms it.
To make it clear, assume that it takes $50 to produce a product that sells for $100. In this case, COGS will be 50% of the sale price. Now, assume that the company reduces the cost of the product to $90, but the cost to produce it remains the same. The COGS to sale price will now be about 56%.
So, we can say that vertical analysis is a good tool to know what is happening in the financial statements. It also helps depict the changes say, the wealth created by the organization by looking at the value-added statement or a drop in the profits. But, it can’t really answer “Why.” Like, as in the above example, we know cost is a major reason for the drop in profits. But, we can’t be sure if the costs have actually risen or the management has cut the prices of the product.
