The market value ratios are important for investors, management, etc. These ratios help decide whether the shares are overvalued, undervalued, or at par with the market. These ratios help in making investment decisions in stocks of companies.
While making an investment in stocks, there are various financial metrics that are used to properly evaluate the prices of the shares or the market value of the shares so that the investment does not become a losing proposition. One of the majorly used financial metrics is the market value ratio. It measures and analyzes the prices of the stocks and compares the market prices with the peer industries and against other facts and figures. These ratios check the financials of the public companies which are traded in the secondary market to understand their financial position, whether the stocks are rightly valued or not, and at what price shares should be bought or sold.
The decision of buying and selling shares is very important. And if not done at the right price, the money invested can turn into losses. So, market value ratios calculation and interpretation are very crucial; for share market investments as well as in other investments; and for the company management as well.
What are Market Value Ratios?
The market value ratios are the financial metrics used to evaluate the stocks’ worth of publicly traded companies. Investors mainly use these ratios to check whether the prevailing market share prices are in sync with the company’s performance. And thus valued correctly in the market, or they are trading at a higher price or lower. The overvaluation or undervaluation of shares helps investors decide whether they should go long or short on the shares they will invest in. If a share is overpriced, the price will fall for sure in the future, and thus an investor should short the shares for a while. And if the stock is underpriced, then one should go long on it.
Also Read: P/E Ratio
The share market investors use different market value ratios, below are some of the most used ratios:
Price to Earnings or P/E Ratio
This is the most used and important ratio under this category of ratios. It checks whether the shares are over or underpriced in comparison to their earnings potential. It is measured as the share price in the current time against the earnings the company has reported for the financial period on a per-share basis. For a detailed understanding, we recommend you to go through our detailed post on P/E Ratio.
Earnings per Share
This ratio shows the company’s earnings earned in the period under the analysis period with respect to the outstanding number of the company’s shares during that period. This ratio helps in understanding whether investing in it is worth the money or not. For further details about this ratio, please reach our exclusive post on Earnings Per Share.
Cash Earnings per Share (CEPS)
As we all know, cash is a very important part of business operations, sustenance, and growth. Cash earnings per share are of recent evolution and give a glimpse of the actual cash earned by the company per share. This is a further variation to the EPS. The formula to calculate the CEPS is somewhat like EPS with a small difference that all the non-cash items in the profit and loss statement are also added.
The exact formula is :
CEPS = (Net Earnings of the Company+ All non-cash expense items (depreciation, amortization, etc) – Tax Provision) / outstanding number of equity shares. This is a very simple and easy formula; therefore, this formula is popular with common investors.
There is one more formula to calculate CEPS. Analysts and big investors prefer to use this one. The result of both formulas at times varies slightly. The alternate formula is :
CEPS = Operating Cash Flow / Outstanding Number of Shares
This metric is quite important and critical in the case of start-ups capital intensive industries, where the expansion or diversification plan is underway or has just been completed, and full capacity utilization may take some time.
Book Value per Share
This ratio is again one of the most important market value ratios to analyze and decide whether the market price per share of the company is how near or far with respect to its book value per share. This ratio shows the relationship between the company’s book value (total equity excluding the preference shares of the shareholders) and the outstanding shares in the market. Book Value is the intrinsic value in terms of fundamental analysis. And it is a total of the contributed value plus the operational profits or losses of the company over the years.
The formula is :
Book Value Per Share= (Equity Share Capital of the Company + All reserves and Surplus (part of shareholders kitty))/ the number of outstanding equity shares of the company.
Market Value per Share
To obtain this ratio we need to divide the total market value of the shares by the number of outstanding shares. This gives the per-share price in the market.
In other words, it is the total market capitalization of the company in the secondary market / total number of outstanding shares of the company.
Thus, Market Value or the trading price could suggest the total market capitalization of the company or vice versa.
Dividend Yield
Investors check both the price and dividend earnings from a share. So, this ratio helps measure the amount of dividend distributed in a year against the number of outstanding shares. This gives an insight into the company’s earnings, and investors can decide whether they want to invest in the shares which pay a certain level of dividend against the current price of the share in the market.
Market to Book Ratio
This ratio shows the relation between the market value of a share to its book value. And thus, one can easily figure out the difference between the two to evaluate under or overvaluation as per the equity standing in the books.
Detailed post at Market to Book Ratio
Enterprise Value
It is the value of the whole enterprise, including market capitalization and short-term and long-term liabilities, excluding cash and cash equivalents.
The formula is:
| Enterprise Value = Market Capitalization + Debt + Preferred Share Capital + Minority Interest – Cash and Cash Equivalents |
Read more at Enterprise Value
Calculation and Formulas of Different Market Value Ratios
The formula for each market value ratio is as follows:
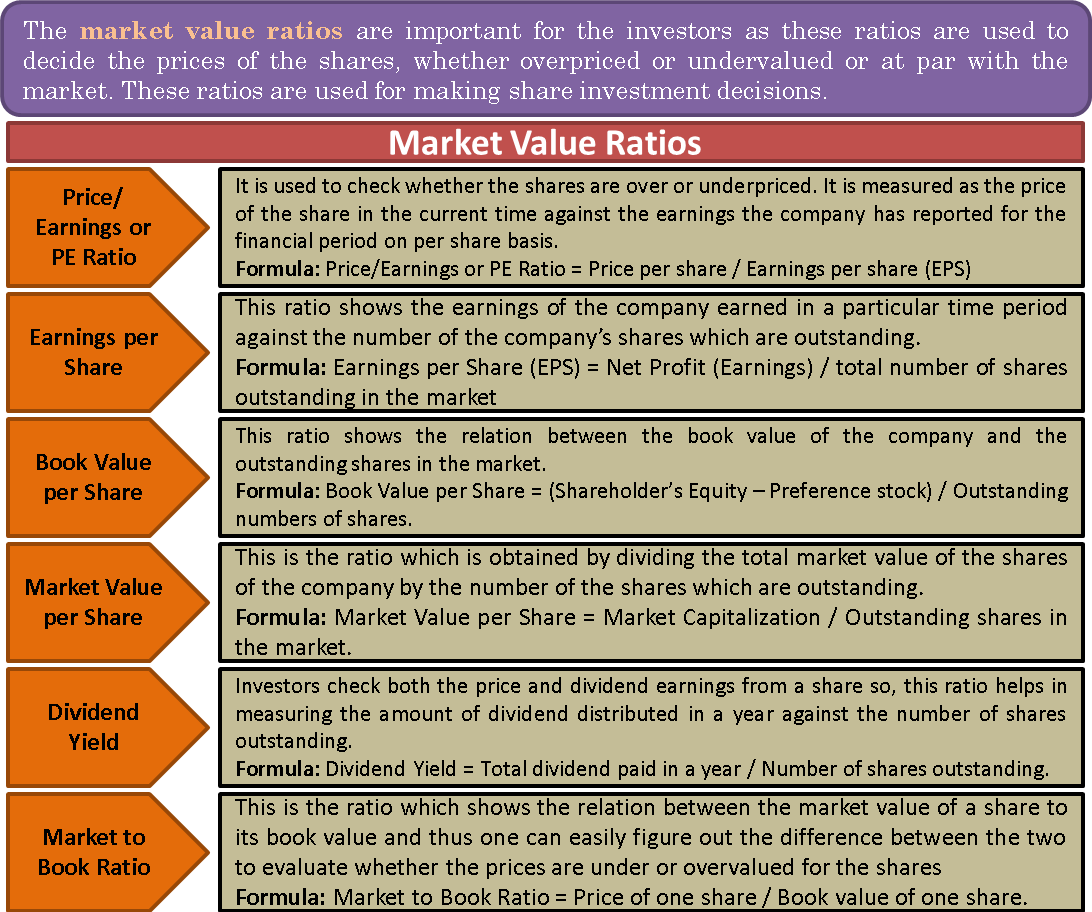
- Price/Earnings or PE Ratio = Price per share / Earnings per share (EPS)
- Earnings per Share (EPS) = Net Profit (Earnings) / total number of shares outstanding in the market
- Cash Earnings per Share (CEPS) = Net Profit + Non-cash items / outstanding shares in the market.
- Book Value per Share = (Shareholder’s Equity – Preference stock) / Outstanding numbers of shares.
- Market Value per Share = Market Capitalization / Outstanding shares in the market.
- Dividend Yield = Total dividend paid in a year / Number of shares outstanding.
- Market to Book Ratio = Price of one share / Book value of one share.
Uses of Market Value Ratios
The usage of market value ratios is varied. And some of the most important uses are as follows –
- It gives an insight to the investor about the price of the shares financial and managerial efficiency of the company.
- It also helps in the analysis of the future prospect of the company.
- This helps in analyzing the different trends in the stock market.
- It is useful in finding out the undervalued shares which have a high potential to earn money in the future.
Conclusion
Market value ratios are critical and useful for all sorts of stock investing. And be it secondary market investments, be it an investment in a company as a minor or major stakeholder, or be it for merger and acquisition decision, etc. The different market value ratios provide different insights into the company. And investors can decide about their investments and strategies using these ratios.
