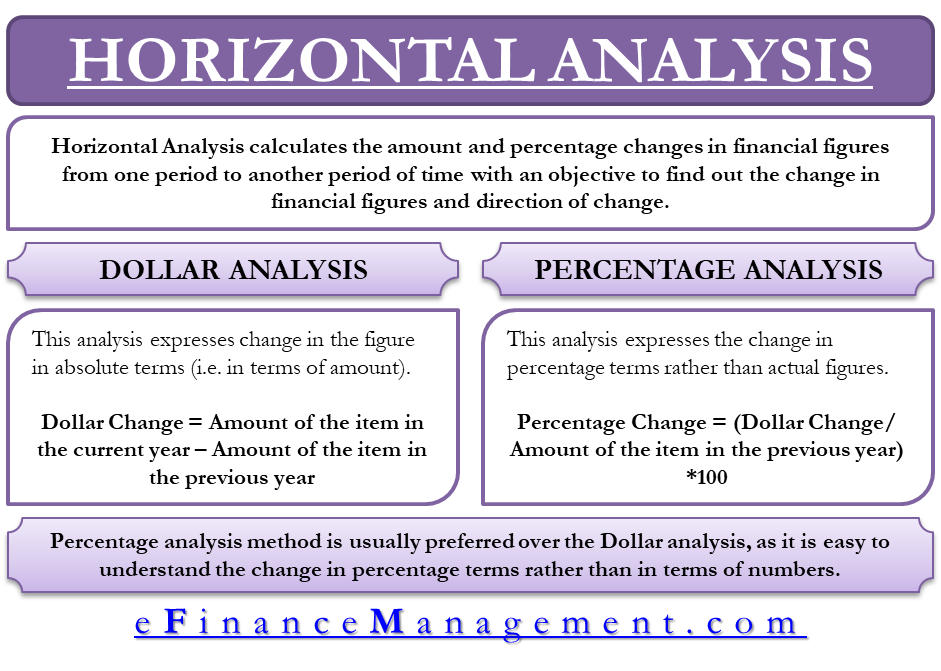
Horizontal Analysis calculates the amount and percentage changes in financial figures from one period to another period of time. In other words, it compares financial data for at least two years/months/quarters/periods. The objective is to find out the change in financial figures and the direction of such change.
Let’s understand Horizontal Analysis with the help of an example. Suppose Smith owns an ice cream shop in Florida. At the end of the financial year 2017-18, he prepared the profit and loss account for his business. After preparing the profit and loss account of his ice-cream business and analyzing it, he concludes that the sales of his ice are very low. He also concludes that his business needs a marketing campaign to boost sales. He ran a marketing and advertisement campaign for the full year 2018-19 and Sat the evaluate the results of his marketing campaign.
The major objective of launching the marketing campaign was to increase sales of his ice-creams. So, he sits down to find out if the sales of his ice-creams increased over the previous year. This is what horizontal analysis is all about. You compare the financial results of two different periods to determine if the results have improved or gone down.
There are two horizontal analysis methods- Dollar Analysis and Percentage Analysis.
Dollar Analysis
This method of horizontal analysis expresses the change in figures in absolute terms or in terms of amount. Continuing the above example of Smith and his ice-cream business, suppose Smith finds out that total sales of ice-creams for the financial year 2018-19 stand at $ 50,000. Now suppose the sales of his ice-creams for the previous financial year 2017-18 was $30,000. Calculating the difference, he gets to know that his ice-cream sales have improved by an amount of $20,000. His marketing campaign was successful. Dollar analysis stops here. As mentioned before, dollar analysis tells us the change in terms of absolute values or change in terms of amount.
Also Read: Year-over-Year (YoY) Growth
Dollar Change = Amount of the item in the current year – Amount of the item in the previous year.
Percentage Analysis
This method of horizontal analysis expresses the change in financial values in terms of percentage rather than in terms of actual figures. So, in our example of Smith’s ice-cream business, a percentage analysis will tell him that his ice-cream sales have increased by 66.67% ((50,000 – 30,000/30,000) *100).
Percentage Change = (Dollar Change/ Amount of the item in the previous year) *100
Percentage analysis as a method of horizontal analysis is usually preferred over dollar analysis for a simple reason. It is always easy to understand the change in percentage terms rather than in terms of actual values. E.g., If Smith tells his friends that he has increased his ice-cream sales by an amount of $20,000, they may not be much impressed. A $20,000 increase in one complete year is not a very big change. However, if Smith tells his friends that he has increased the sales by 66.67%, now he is talking! A 66% increase in sales in a year speaks that the business is growing rapidly.
Horizontal Analysis of an Income Statement
Horizontal Analysis doesn’t conclude with finding the change in sales over a period. To get a clear picture of the performance of our business, we need to do a horizontal analysis of each item in our income statement. A complete horizontal analysis of the income statement might tell us that while our sales figure increased by 66.67%, our profits declined by 10% over the previous year. There can be many reasons for this. E.g., the increase in sales might have resulted because of proportionately higher marketing expenditure, resulting in a dip in profits.
Suppose given below are the income statements for this year and the previous year for Smith’s ice-cream business.
Horizontal Analysis – Income Statement for the Years Ended March 31st
(in dollars)
| Particulars | 2017-18 | 2018-19 | Dollar Change | Percentage Change |
|---|---|---|---|---|
| 1. Revenue from sales | 30,000 | 50,000 | 20,000 | 66.67 |
| 2. Cost of goods sold | 15,000
_______ | 22,000
_______ | 7,000 | 46.66 |
| 3. Gross Profit (1-2) | 15,000 | 28,000 | 13,000 | 86.66 |
| 4. Selling and Administrative Expenses | 5,000
_______ | 15,000
_______ | 10,000 | 200.00 |
| 5. EBITDA (3-4) | 10,000 | 13,000 | 3,000 | 30.00 |
| 6. Depreciation and Amortization Expenses | 3,000
_______ | 3,000
_______ | 0 | 0 |
| 7. EBIT (5-6) | 7,000
| 10,000 | 3,000 | 42.85 |
| 8. Interest | 2,000
_______ | 2,000
_______ | 0 | 0 |
| 9. EBT or Profit before Tax (7-8) | 5,000 | 8,000 | 3,000 | 60.00 |
| 10. Tax (20%) | 1,000
_______ | 1,600
_______ | 600 | 60.00 |
| 11. Net Profit | 4,000 | 6,400 | 2,400 | 60.00 |
Analysis
The above example of Horizontal analysis shows us that a 66% increase in sales led to a 60% increase in net profits. The increase in Selling and Administrative expenses by 200% (remember Smith’s marketing and Advertisement campaign) explains this gap of 6%. A decrease in proportionate Cost of Goods Sold also contributed to the increase in net profits.
Also Read: Vertical Analysis – Meaning, Common-size Financial Statements, Benefits, Drawbacks and More
In some cases, it may happen that an attempt to increase the sales results in lower net profits. Suppose a company spends $50,000 in a year to increase its sales by $30,000. Also, suppose that $30,000 worth of sales gives a net profit of $15,000. In this case, the net profit of that company will come down by $35,000 as an expenditure of $50,000 could only add $15,000 to the company’s net profits. Therefore, horizontal analysis is extremely useful for businesses to understand how the numbers in their income statement are moving.
Other techniques that can be used for horizontal analysis include:
Cautions While Relying on Horizontal Analysis
Horizontal Analysis can be used to misguide or manipulate the outside parties. Usually, the purpose of such manipulation is to artificially make the results of this year appear good. This can be done by comparing the current period’s performance with that period which will make the current period’s performance look good. E.g., if I compare the sale of greeting cards this Christmas season with the last year’s Christmas season, growth in sales may not look great. But, if I compare this Christmas season’s sale with the previous month’s sale, the results will be amazing, as the previous month was an offseason for me.
Read more on other Methods of Financial Statement Analysis.
