DuPont Analysis: Meaning
It is an approach for computing return on equity (ROE) encompassing a broad level of indicators leading to this return. DuPont analysis calculator calculates this ROE using three different factors. These factors include operating efficiency, the efficiency of assets in generating revenues, and the efficiency of assets in earning for shareholders’ funds. So, it is a combination of Operating performance, resource utilization (assets use), and deployment of funds.
Return on equity (ROE) is a measure to determine the efficiency of a company in earning returns on the money invested by the equity shareholders. An investor will always be willing to invest in a company that commands a higher return on equity.
Formula
It is the profit that a company derives for every dollar invested by the shareholders in the company. ROE or Return on Equity is given by:
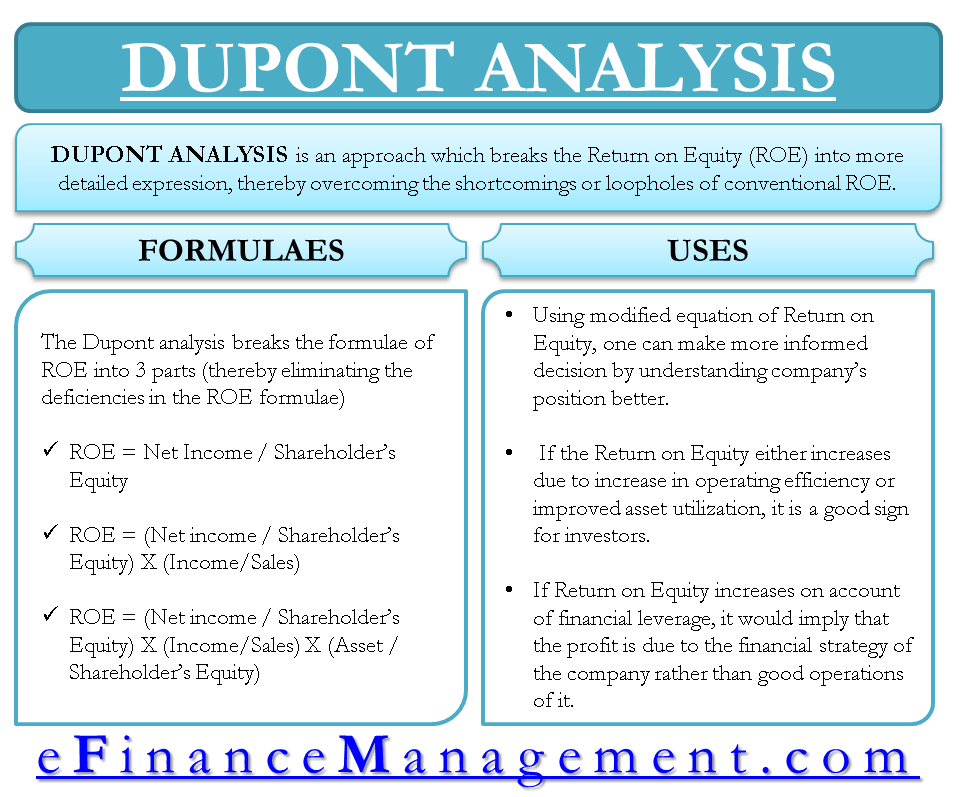
| Return on Equity (ROE) = Net Income / Shareholder’s Equity |
Net Income = Net profit derived from the business
Shareholders’ Equity = Capital invested by shareholders of the company
ROE is a simple ratio and requires only 2 figures to calculate. Net Income and Shareholders Equity. The higher this ratio, the better are the returns that shareholders get for every dollar invested. So, ideally, from an investor’s point of view, Return on Equity should be as high as possible.
Also Read: DuPont Analysis Calculator

ROE focuses only on the returns of the equity shareholders. It only measures a percentage rate of return earned by the investors from the underlying company. Therefore, the scope of this ratio is relatively narrow. On the contrary, the ratio is converted into an expression by DuPont, which presents the returns earned by the investors and talks about three important parameters of a company’s performance. These three parameters are Profitability, Operating Efficiency / Asset Utilization, and Financial Leverage.
DuPont Analysis overcomes this drawback of ROE. It breaks ROE into 3 parts; thereby, one can analyze the reason for the increase/decrease in ROE.
| ROE = Net Income / Shareholder’s Equity |
Multiplying the equation by sales
| ROE = (Net Sales / Shareholder’s Equity) * (Income / Sales) |
Again multiplying the above equation by assets/assets
| ROE = (Net Income / Sales) * (Sales / Assets) * (Assets / Shareholder’s Equity) |
The above equation for ROE is broken down into 3 components:
- Net Income / Sales = Operating Efficiency (as measured by profit margin).
- Sales / Assets = Asset Utilization (as measured by total asset turnover).
- Assets / Shareholders’ Equity = Financial leverage (as measured by the equity multiplier).
Get quick help from DuPont Analysis Calculator.
Use of DuPont Analysis
Company’s profit margin is low, it may focus on cost-cutting measures or product pricing strategies to improve profitability. If asset turnover is low, Company may seek ways to enhance operational efficiency or explore new markets to boost sales. Additionally, the Company may analyze its financial leverage to assess its debt management and make decisions regarding optimal capital structure.
Using the modified equation of Return on Equity, one can make a more informed decision and understand the company’s position better. If the Return on Equity increases due to an increase in operating efficiency or improved asset utilization, it is a good sign for investors. It would imply that either company is making higher margins on its sales, the company is making better use of its assets, or both.
On the other hand, if the Return on Equity increases on account of financial leverage, it would imply that the profit is due to the company’s financial strategy rather than good operations. Too higher a debt ratio also makes a company a riskier proposal for investment.
Also Read: Return on Equity (ROE)
In essence, a manager should try increasing the ROE by either higher operating efficiency or better asset utilization. There is no reservation for using the third parameter, i.e., financial leverage, but it will increase the risk of bankruptcy if the lenders ask for a large sum of money.
Example
Let us try to understand the concept well with the help of an example. The data of three companies (X, Y, and Z) are given as below:
| Particular | Company X | Company Y | Company Z |
|---|---|---|---|
| Net Income | 40,000 | 50,000 | 52,000 |
| Sales | 198,000 | 500,500 | 325,200 |
| Total Assets | 660,000 | 1,668,335 | 1,084,000 |
| Shareholders’ Equity | 330,000 | 501,000 | 429,043 |
The three factors under DuPont analysis are:
| Factors | Formula | X | Y | Z |
|---|---|---|---|---|
| Net Margin (a) | Net Income/Sales | 0.20 | 0.99 | 0.16 |
| Asset Turnover (b) | Sales/Total Assets | 0.3 | 0.3 | 0.3 |
| Financial Leverage (c) | Total Assets/Shareholders’ Equity | 2 | 3.33 | 2.53 |
The ROE under DuPont analysis is (a*b*c):
Company X = 0.2*0.3*2 = 0.12 or 12%
Company Y = 0.99*0.3*3.33 = 0.989 or 9.89%
And, Company Z = 0.16*0.3*2.53 = 0.12 or 12%
Interpretation
In the above example, the ROE of companies X and Z is 12%. While the ROE of company Y is 9.89% which means companies X and Z are better at generating returns for investors (shareholders) in comparison to company Y.
Du Pont’s analysis gives a different dimension to our understanding, though the ROE remains the same by this method or other shortcut methods. However, here if we observe the asset utilization efficiency is almost the same for all three entities. However, there is wide variance with regard to the profit margin and financial leverage. Of course, in isolation, it does not say anything unless it is compared with a company belonging to the same industry segment. However, if all three belong to the same industry, then management can think about how to improve the margin and effective funds deployment. And that can lead to an improvement in the ROE.
Read more about other Methods of Financial Analysis.

Thanks for your help sir
can Book Debts (Receivables) be security in Term Loan.