Financial statement analysis (FSA) means studying the financial statements of a company to get meaningful information for decision-making. External stakeholders also carry out financial statement analysis for several purposes, apart from management. There are several methods of financial statement analysis that management and external stakeholders use.
All these methods vary in calculation and factors used for the financial statement analysis. External stakeholders, including analysts, financial institutions, creditors, lenders, etc., do FSA to understand the company’s health. Moreover, these methods provide a summary of data that helps to analyze and interpret financial data.
Methods of Financial Statement Analysis
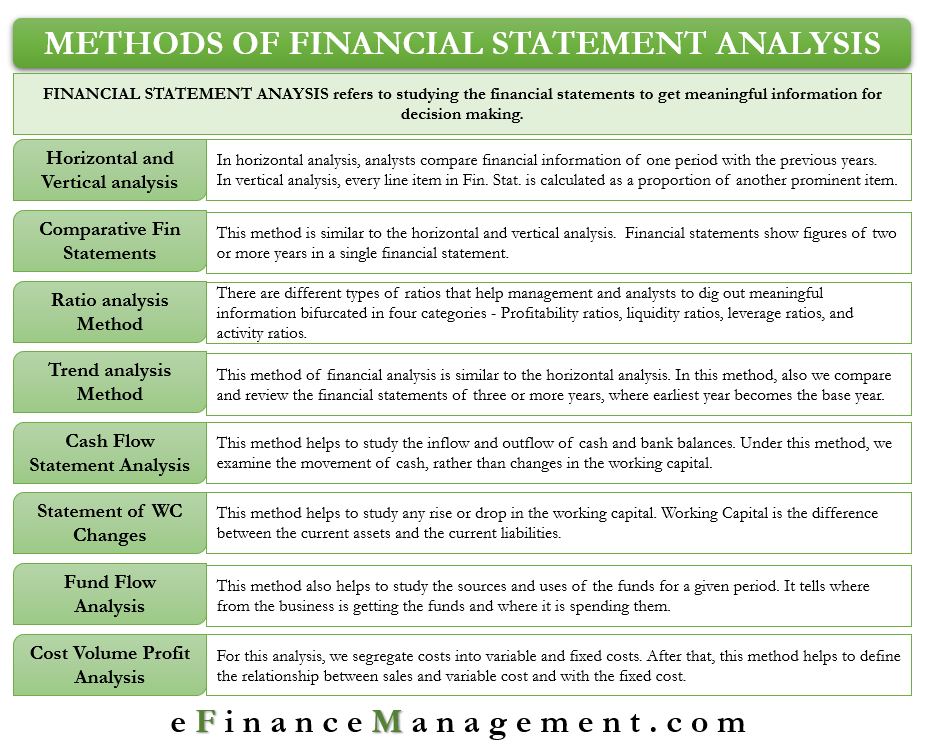
The following are the most popular methods of financial statement analysis:
Ratio Analysis
Ratio analysis is amongst the most popular methods of financial statement analysis. There are different types of ratios that help management and analysts to dig out meaningful information.
There are six categories of ratios:
- Profitability ratios
- Liquidity ratios
- Leverage ratios
- Coverage ratios
- Activity ratios
- Valuation ratios
Some popular ratios are the current ratio, PE ratio, debt ratio, and more.
After analysts calculate a ratio (or ratios), they can compare it with the same ratio of previous years. Or, they can also compare it with the industry average or with the competitors. Also, one can compare the ratios with the set standards or the ideal ratio. For instance, the current ratio of 2:1 is excellent. However, the benchmark or ideal ratios vary from industry to industry.
Also Read: Ratio Analysis
To learn more about it, refer to RATIO ANALYSIS
DuPont Analysis
DuPont analysis breaks up the ROE (Return on Equity) formula into three ratios to help in understanding the cause and effect relationship of different factors resulting in ROE. We simply divide net earnings available for equity shareholders by shareholders’ equity in order to calculate ROE. But, DuPont analysis split this formula into a product of net profit margin, asset turnover, and financial leverage.
Refer to DUPONT ANALYSIS for in-depth understanding.
Horizontal Analysis
In horizontal analysis, the analysts compare the financial information of one period with the previous years. In this, we compare a line item with the same line item in another period (a year or quarter). The objective is to find any significant change in any line item. For instance, if the cost of goods sold (COGS) rises much more than the increase in sales or gross profit rises but net profit drops.
Keep reading HORIZONTAL ANALYSIS
Vertical Analysis
In the vertical analysis, every line item in the financial statement is calculated as a proportion of another prominent item. Usually, each line item is calculated as a proportion of revenue or sales in the income statement. Each line item is represented as a proportion of total assets on the balance sheet. After calculating ratios, one can compare them with the past years to identify any unusual happenings.
For more, refer to VERTICAL ANALYSIS.
Comparative Financial Statements
Analysis using the comparative financial statement is similar to the horizontal and vertical analysis. In this method, we prepare the income statement and balance sheet in a way to get a time perspective of the line items. Or, we can say the financial statements show figures for two or more years in a single financial statement. It makes it easy to compare a line item with the previous years.
Also Read: Importance of Ratio Analysis
These figures could either be absolute, absolute increase or decrease from the past year, in terms of percentage or comparison as ratios.
Trend Analysis
This method of financial analysis is similar to horizontal analysis. In this method also, we compare and review the financial statements for three or more years. Under trend analysis, the earliest year becomes the base year. The objective is to find any pattern in the financial numbers. These patterns could be rising (or falling) sales, any seasonal trend, fluctuations in expenses, and more. An analyst can also use ratios to identify trends (if any) in the financial numbers.
Keep reading TREND ANALYSIS
Other Methods of Financial Statement Analysis
Apart from the above popular methods, there are many more (but less popular) methods that help a business make decisions. These methods do not precisely fall under financial statement analysis, yet they assist analysts, management, and other stakeholders in arriving at a decision. These methods are:
Cash Flow Analysis
This method helps to study the inflow and outflow of cash and bank balances. Under the cash flow analysis method, we examine the movement of cash rather than changes in the working capital. The study of cash flow tells the purpose: investing, operations, and more, for which the company is using its funds. Moreover, it also shows the source of those funds.
Statement of Changes in Working Capital
Changes in the working capital method help to study any rise or drop in the working capital. Working Capital is the difference between the current assets and the current liabilities. In other words, current liabilities get deducted from the existing assets to arrive at the value of working capital. However, this method fails to give the reason for the differences in the working capital.
Fund Flow Analysis
This method also helps to study the sources and uses of the funds for a given period. It tells wherefrom the business is getting the funds and where it is spending them. Moreover, fund flow analysis also assists in highlighting changes (if any) in a company’s financial structure.
Performance Analysis
Even though a business conducts financial analysis to analyze how it is performing, some non-financial performance measures also help evaluate its performance. A business turns more profitable if it satisfies its stakeholders and achieves its profit targets. Hence, it also establishes non-financial standards, which ultimately help in performance evaluation.
There are various ways that help a business in conducting performance analysis. It includes KPIs (Key Performance Indicators), benchmarking, etc.
In the Black vs. In the Red
This method owes its existence to the period when financial statements were used to be handwritten. ‘In the black’ indicates that the company is in the profitable stage, while ‘in the red’ means the company is not profitable.
Read more about it at In the Black Vs. In the Red
Final Words
In the absence of the above methods of financial statement analysis, it could be challenging to carry out a financial review. These methods make FSA easier by organizing the collection and evaluation of financial information. Banks, auditors, analyst firms, credit rating agencies, lenders, etc., use these methods to understand the health of a company.
Quiz on Methods of Financial Statement Analysis
Let’s take a quick test on the topic you have read here.
