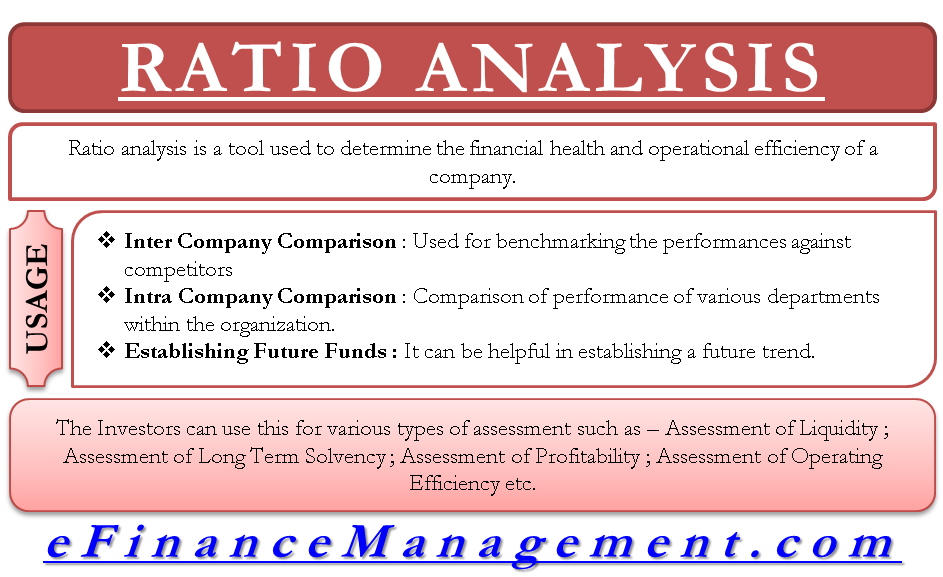
Ratio analysis is a tool to determine the financial health and operational efficiency of a company. Top management utilizes it to gauge the performance of the company, and it helps investors to analyze the business from various angles and make an informed choice before investing in it. Let’s have a look at the advantages and applications of ratio analysis.
How Can Company Management Use Ratio Analysis?
Today, we will see how company management can use or apply the ratio analysis to maximize its benefits.
Inter-Company Comparison
Ratio analysis can be an excellent tool for companies to benchmark their performances against the best in the business. If your competitors are doing well, analyzing their financial statements will give you an idea as to which areas you are lacking against your competitors. This way, you can point out your weak areas or areas for improvement.
Intra-company Comparison
Ratio analysis can also be used to compare the performance of various departments within the same company. The management can use this to find out the departments that are pulling the overall performance of the entire company.

Trend Identification
By comparing ratios over several periods, management can identify trends and patterns that indicate areas of strength or areas that need improvement. This aids in making proactive decisions.
Also Read: Limitations of Ratio Analysis
Informed Financial Decisions
Ratios provide valuable insights into various aspects of the company’s financial health. Management can use this information to make informed decisions about capital allocation, resource allocation, expansion plans, and other strategic moves.
Communication with Stakeholders
Ratio analysis provides a clear and concise way to communicate the company’s financial health to stakeholders, including investors, creditors, and potential partners.
How Can Investors Use Ratio Analysis?
Investors can use ratio analysis to measure the performance of various companies. Ratio analysis can be used to measure the profitability of various companies, their credit policies, how solvent the company is, how liquid its assets are, is the company management efficient enough, etc. Using all this data, the investors can decide before investing in a company.
Assessment of Liquidity
Liquidity ratios are a class of financial metrics that helps to determine the ability of a company to meet its immediate short-term debt obligations. The higher the value of these ratios, the better the company’s position to meet its debt obligation. On the other hand, a very high value of these ratios may suggest that the company is not making prudent investment decisions and sitting on a pile of un-invested cash.
This will help the investors to choose the company with less risk and more future profits.
Liquidity ratios make use of current assets and current liabilities. Some of the common liquidity ratios are:
1. Current Ratio = Current Assets / Current Liabilities
2. Acid Test Ratio = (Current Assets – Stocks) / Current Liabilities
Assessment of Long-Term Solvency
Solvency ratios help determine a company’s ability to meet its long-term obligations. Suppose a company has a low value of solvency ratios. It may create doubt in investors’ minds about whether the company is capable of meeting its debts and that it may default on its obligations.
Also Read: Ratio Analysis
This ratio will help an investor save himself from a company that might incur a massive loss in the near future.
Some of the commonly used solvency ratios are given below.
1. Debt Ratio = Total Debt / Total Assets
2. Debt-Equity Ratio = Total Liabilities / Total Owner’s Equity
3. Indebtedness Ratio = Total Debts / Total Liabilities
Assessment of Profitability
The most widely used ratios are the profitability ratios. At the end of the day, no matter what a company tries to do, its ultimate goal is to maximize its profits and wealth. Profitability ratios analyze how profitable a company is in comparison to the investments made and the revenue it generates.
Here, an investor will be able to select a company with higher returns.
Some of the commonly used profitability ratios are given below.
- Net Profit Margin = Net Income / Total Revenue
- Return on Equity = Net Income / Average Owner’s Equity
- Return on Assets = Net Income / Average Total Assets
Assessment of Operating Efficiency
Efficiency ratios measure how effectively a company utilizes its assets and manages its debts. Efficiency ratios measure the pace of the cycle of accounts receivable, accounts payable, and inventory.
The more efficiently a company uses its resources, the more returns it will be able to generate. So, in the end, the goal of every investor to get higher returns will be fulfilled.
Some of the common ratios in this category are given below.
- Inventory Turnover Ratio = Cost of Goods Sold / Average Inventory
- Accounts Receivable Turnover = Revenue / Average Accounts Receivable
- Accounts Payable Turnover = Cost of Goods Sold / Average Accounts Payable
Due Diligence
Ratio analysis is a part of a comprehensive due diligence process for potential investments. It helps investors make informed decisions based on a thorough understanding of a company’s financial position.
Exit Strategy
When considering selling a stock, investors can use ratio analysis to assess whether the company’s financial health has changed significantly since their initial investment. This can help in making well-timed exit decisions.
Conclusion
Ratio analysis can do wonders for both investors and a company. If a company uses this tool and realizes its weaknesses and strengths, and at the same time, if it starts working upon them, it can create a lot out of it. They can work on their weaknesses to improve and strengths to carry forward. Now, it is the investor’s turn; if the investors analyze the ratios properly and understand them correctly, then they can be saved from a huge loss and can move forward toward a more profitable venture.
Refer to the article IMPORTANCE OF RATIO ANALYSIS for more Knowledge
