Loan Life Coverage Ratio: Meaning
It is a coverage ratio used to check the solvency status of the borrowing company. It is a measure used by companies and lenders to check the loan repaying capacity, especially in the case of specific projects. Loan Life coverage ratio (LLCR) is a common way to check the ‘project’s’ potential of paying back loans through its cash flows. LLCR is calculated by dividing Cash flows with discounting factor, available from the project, by the total outstanding debt amount.
LLCR checks the ability of the project to pay off loans by looking at the discounted cash flows. Therefore, using discounted cash flows is a better estimate in understanding the risk of the project. This discounting process will take care of the timing of these cash flows and will also help in deciding between the competing projects.
Calculation of LLCR
In the numerators, LLCR uses the discounted cash flows of the project. Along with the discounted cash flows, the analyst also adds cash or any other specific reserve created to service the debt. The number is achieved by adding the cash flows and reserves and then dividing it by ‘total outstanding debt’ or the remaining debt that is needed to be paid off.
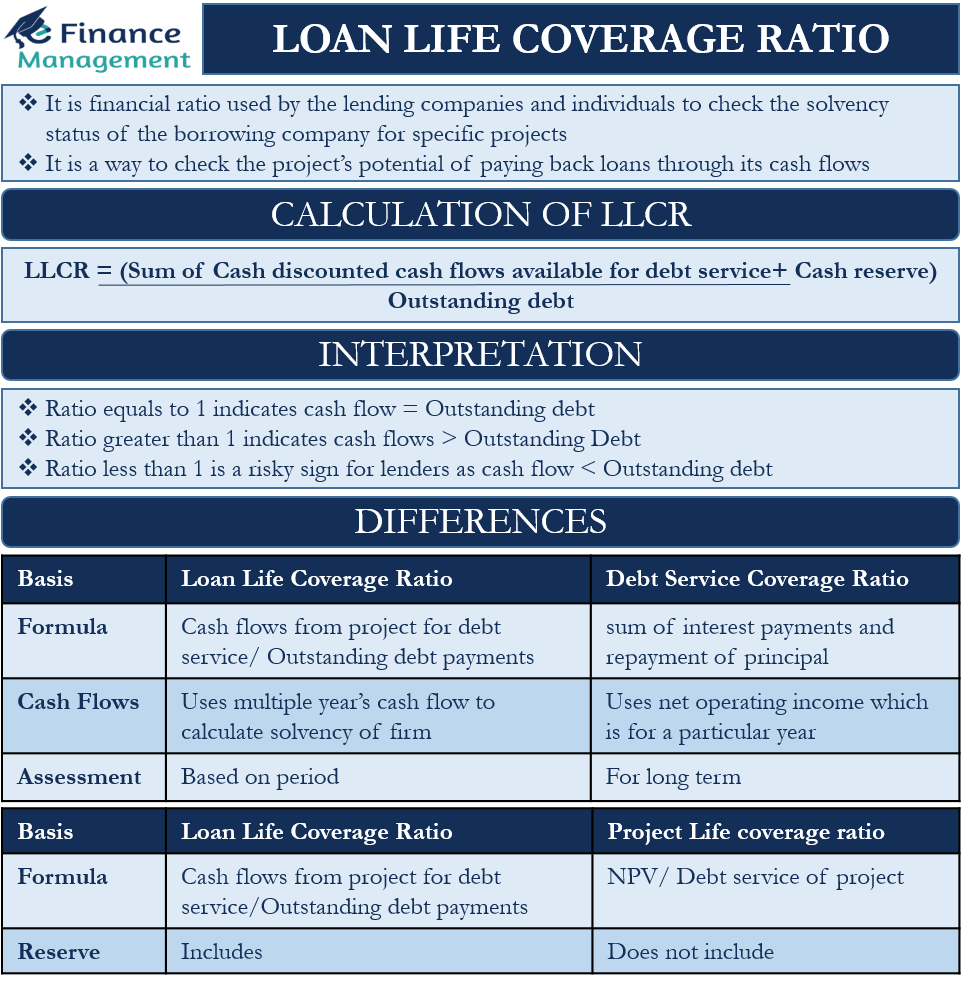
LLCR = (Sum of Cash discounted cash flows available for debt service+ Cash reserve) / Outstanding debt
LLCR can be calculated at any point in time. If the loan is taken for a total of 10 years, it can be calculated when the remaining time is 5 years, either annually, semi-annually, or quarterly. The discounting rate is the rate at which the firm has borrowed the loan, that is the cost of the loan.
Also Read: Interest Service Coverage Ratio
Interpretation of LLCR
In the case of LLCR, the higher the ratio is the better it is for the lender. A 1x ratio indicates that the project’s cash flows are equal to the outstanding loan amount. While a higher ratio indicates that the project’s cash flows are higher than that of the outstanding debt amount. On other hand, a ratio of less than one poses a risky sign for the lender. It means the discounted cash flows plus the cash reserves are lesser than the outstanding amount and is not enough to cover the outstanding loan amount. Sometimes when the lender finds the project risky then he/she imposes covenants or can also demand maintenance of cash reserve. This will give comfort to the lender and reduce the risk profile of the project for the lender. Hence, the higher the ratio, the less risk and it is better for the lender.
Loan Life Coverage vs Debt Service Coverage Ratio
The main difference lies in the formula. We use Cash flows from the project for debt service/ Outstanding debt payments for calculating LLCR. Whereas for calculation of the Debt Service Coverage Ratio we take into account the overall net operating income plus the interest as well as the non-cash expenses. Here, debt service is equal to the sum of interest payments and repayment of principal.
Another difference is that LLCR is using the cash flows of multiple upcoming years to calculate the solvency of the firm. Whereas, Debt service coverage ratio uses net operating income which is for a particular year. Hence, DSCR assesses the solvency of the company or project based on the period. LLCR is a better indicator in understanding the solvency position of the project or a firm in long term.
DSCR is a measure that is commonly used for measuring short-term position.
Loan Life Coverage Ratio vs Project Life Coverage Ratio
Project life coverage ratio is calculated by dividing NPV by the debt service of the project. Lenders usually set a minimum floor for the PLCR ratio as it mitigates the risk profile of the lending. The project life coverage ratio does not include the reserve like the Loan life coverage ratio. Also, the LLCR uses discounted cash flows available to the firm, while PLCR uses NPV ( the Net present value is the discounted cash flows of the project, subtracted from the initial cost of the project). A positive NPV is favored in selecting a project as it indicates positive cash flow and is a sign of profitability.
In all, the lenders assess the solvency of a firm or a project by looking at all three ratios; Loan life coverage, project life coverage, and debt service coverage ratio. It helps them understand the big picture and plays a crucial role in assessing the risk profile of the project.
Example
| Particulars | 2020 | 2021 | 2022 | 2023 |
|---|---|---|---|---|
| PV of CFDS (2020) | 100 | |||
| PV of CFDS (2021) | 140.2 | 150.0 | ||
| PV of CFDS (2022) | 174.7 | 186.9 | 200 | |
| PV of CFDS (2023) | 204.1 | 218.4 | 250 | |
| Net Present Value | 618.9 | 553.3 | 200.0 | 250.0 |
| Debt Outstanding | 450 | 300 | ||
| LLCR | 1.38 | 1.85 |
As we can see, the present value of cash flow for debt service in 2020 is equal to $618.9, and for FY 2021 it is 553.3. The discount rate is 7%. To calculate the LLCR the Net present value is divided by the debt amount outstanding. For 2020, the prospects for the lender are positive as the ratio is 1.3. As this is above one indicates the firm has enough cash flows to cover the debt amount. The solvency position is then increased to 1.85 times in 2021. Again showing a positive image on the part of the project. Also, the ratio has increased due to a decrease in the debt amount.
