Basic Earning Power Ratio
It is a metric that reflects the relation of earnings of the company to its assets. And it shows the company’s efficiency in generating earnings from its assets. Hence, the basic earning power ratio calculator helps in checking this efficiency.
Basic Earning Power Ratio – Rationale
The basic earning power ratio helps investors and analysts evaluate a company’s operational efficiency and profitability relative to its asset base. A higher ratio indicates that the company is generating more operating income per dollar of assets, which suggests effective asset utilization. On the other hand, a lower ratio may indicate inefficiencies or lower profitability.
Formula of Basic Earnings Power Ratio
| BEP Ratio = Operating Profit Margin * Assets Turnover Ratio |
Let us try to analyze the breakup of the BEP Ratio. It is the product of Operating Profit Margin & Total Assets Turnover.
- Operating Profit Margin = EBIT / Turnover (Sales). The appropriate representation for Operating Profit is in percent.
- Assets Turnover = Turnover (Sales) / Assets
Example
Suppose Mr. X, having a surplus of $65,000, wishes to make an investment. He is interested in investing in a project of his known one. The estimated net income of the project is $275,000, interest is $35,000, and tax is equal to $90,000. The total assets stand at $3,500,000.
EBIT = 275,000 + 35,000 + 90,000 = 400,000
Basic Earning Power Ratio = (400,000 / 3,500,000) * 100 = 11.43%
Basic Earning Power Ratio – Interpretation
As said above, the higher the basic earning power ratio, the better it is. It simply shows the company’s efficiency in using its assets. The basic earning power ratio in the above example is relatively good. But this cannot be stated true without comparison with a similar project or similar industry.
Also Read: Basic Earning Power Ratio Calculator
Limitations of Basic Earning Power Ratio
- Firstly, BEP is not ultimate. Like all the other financial ratios, it needs to be further analyzed.
- More importantly, it is an indicative factor.
- To conclude, the inference can be made only by combining other ratios and comparing them with Industry Standards.

ROA (Return on Assets) vs. Basic Earning Power Ratio
Return on assets is the relationship between net income and total assets
Unlike BEP, RoA considers operational income and excludes non-operational income.
| Particulars | Company A | Company B |
| Net Income | $500,000 | $400,000 |
| Total Asset | $5,000,000 | $4,000,000 |
| Non-operational Income (e.g., investment gains, one-time sales) | $100,000 | $50,000 |
To calculate the RoA for both companies, we divide their respective Net Income by Total Assets:
RoA for Company A = Net Income / Total Assets = $500,000 / $5,000,000 = 0.1 or 10%
RoA for Company B = Net Income / Total Assets = $400,000 / $4,000,000 = 0.1 or 10%
Both Company A and Company B have a RoA of 10%. RoA measures the profitability of a company’s assets, indicating how efficiently the company is generating profits from its total assets.
Now let’s calculate the Basic Earning Power (BEP) ratio for both companies. BEP considers operational income and excludes non-operational income.
BEP for Company A = Operating Income / Total Assets = ($500,000 – $100,000) / $5,000,000 = $400,000 / $5,000,000 = 0.08 or 8%
BEP for Company B = Operating Income / Total Assets = ($400,000 – $50,000) / $4,000,000 = $350,000 / $4,000,000 = 0.0875 or 8.75%
Both Company A and Company B have a BEP ratio of approximately 8% to 8.75%. BEP measures the operational profitability of a company’s assets, focusing on how well the company’s core operations generate earnings from total assets while excluding non-operational income.
In this example, you can see that the RoA is the same for both companies, indicating that they have similar overall profitability when considering all income sources. However, the BEP ratio differs slightly, reflecting the exclusion of non-operational income and a focus solely on operational earnings.
Refer to RETURN ON ASSETS for more details.
Illustration
For instance, let us assume an investor ‘X’ would like to invest his surplus with either ‘A’ or ‘B.’ Two friends’ ‘A’ and ‘B’ started their own business on 01st January 20xx by investing $ 500,000. They both took two premises on rent for $2,000.
Also Read: P/E Ratio
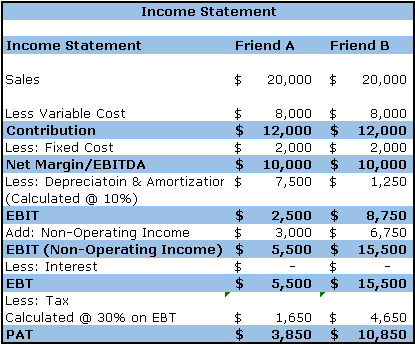
Friend ‘A’ started her own restaurant. She purchased the kitchenware, stoves, chairs, and tables, which cost her $ 300,000. For the first quarter, her sales were $ 20,000, and the expenses were around $8,000. ‘A’ earned an interest of 6 % on $ 200,000 left in the Bank.
‘B’ has started her consultancy firm that designs websites. She leased an office, purchased a laptop, few essential software that cost her $ 50,000. For the first quarter, she earned a revenue of $ 20,000, and her expenses were around $ 8,000. ‘B’ earned an interest of 6 % on $ 450,000 left in the Bank.
Assuming an investor does not have any personal preferences, which one should he prefer and why?
A quick summary of the Quarter Transactions
Income Statement
Representation of the above data to arrive at a Profit
Balance Sheet
Representation of the above data to derive the Financial Position

Calculation of Ratios
Calculation of Basic Earning Ratio can be as follows:
BEP (Basic Earning Power Ratio) = EBIT / Fixed Assets
= $ 5,500 / $292,500 for Friend A = 0.0188 or (1.88%)
= $ 15,500 / $ 48,750 for Friend B = 0.3179 or (31.79%)
RoA (Return of Assets) = Operating Income / Fixed Assets
= $ 2,500 / $292,500 for Friend A = 0.0085 or (00.85%)
= $ 8,750 / $ 48,750 for Friend B = 0.1795 or (17.95%)
As discussed above, the higher the BEP Ratio, the better the company assets are utilized to generate earnings. Hence, we can conclude that the business of Friend B is better for investment as it gives substantially higher returns. In these competing investment scenarios, the BEP Ratio is 0.0188:0.3179 (A: B).
You can also use our calculator – Basic Earning Power Ratio Calculator
Conclusion
Basic Earning Power Ratio is a simple calculation for establishing the relationship between EBIT and the assets. In other words, it shows the earning power of the assets deployed by the entity.
