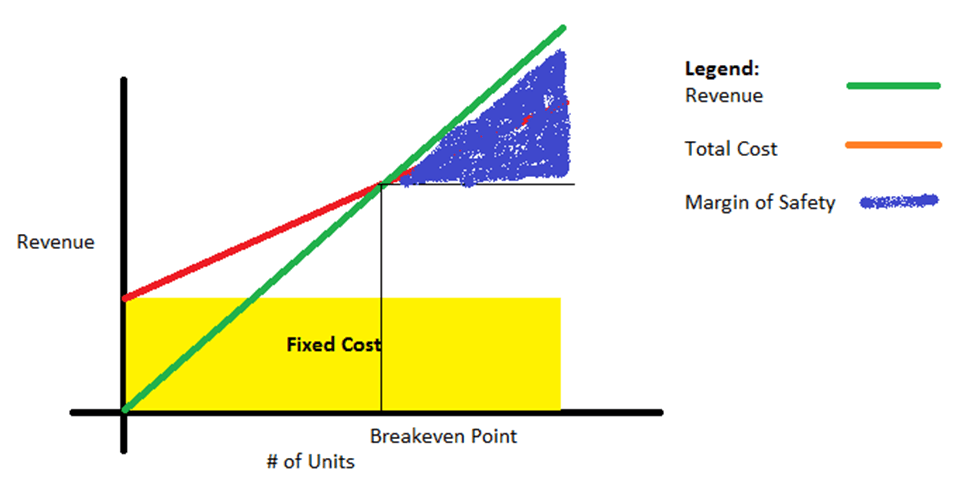
The margin of safety is a tool used in CVP analysis. A business is profitable when revenue exceeds the costs. A part of the revenue is used to cover the breakeven costs, while the remaining part is profit. This remaining part is called the Margin of Safety.
Margin of Safety Definition
The margin of safety is the difference between revenue and breakeven point. We can afford to lose this safety margin before we start losing money in the business. The margin of Safety can be measured in terms of dollars and the number of units.
Margin of Safety Formula
1) Margin of Safety in terms of Dollars
The margin of Safety ($)=Total Revenue-Breakeven Point
2) Margin of Safety in terms of Units
Margin of Safety (# of units)= (Total Revenue-Breakeven Point)/(Selling Price per Unit)

Margin of Safety Ratio
It can also be written as a percentage of sales or revenue.
Margin of Safety= (Revenue-Breakeven Point)/Revenue
Margin of Safety Calculation with Example
A company, XYZ, manufactures camshafts. It has 10 workers working 8 hours a day at a wage of USD 12/hour. The company pays out rent on the production facility, which is USD 2000/month. Utilities and other costs come out to be about USD 800/month. The company uses steel as the primary raw material, which costs about USD 50 for producing one camshaft unit. In addition, the polishing and grinding cost is about USD 5 per unit. XYZ sells one camshaft at USD 100/unit. What is the margin of safety if the company produces:
- 5000 units annually
- 10000 units annually
- 20000 units annually
Assume the factory works for 250 days a year.
To get this, we first need to calculate the breakeven point, which is done as follows:
| Fixed Cost | |||
| No. of Workers | A | 10 | |
| No. of Working Hours/day | B | 8 | |
| No.of Working Days/annum | C | 250 | |
| No. of Man Hours/annum | D = A*B*C | 20000 | |
| Wage/Hour | E | $12 | |
| Annual Labour Cost | F = D*E | $240,000 | |
| Monthly Rent | G | $2,000 | |
| Monthly Utilities | H | $800 | |
| Monthly Rent and Utilities | I = G+H | $2,800 | |
| Annual Rent and Utilities | J = I*12 | $33,600 | |
| Variable Cost | |||
| Raw Material/Unit | K | $50 | |
| Polishing and Grinding/Unit | L | $5 | |
| Variable Cost/Unit | M = K+L | $55 | |
| Revenue | |||
| Selling Price/Unit | N | $100 | |
| Breakeven Point | |||
| Contribution/Unit | O = N-M | $45 | |
| BreakevenNo. of Units | P = (F+J)/O | 6080 | |
| Breakeven Revenue | Q = P*N | $608,000 | |
You can also use the Margin of Safety Calculator.
Now, the margin of safety for various production scenarios is as follows:
| Breakeven Revenue | A | $608,000 | |
| Selling Price/Unit | B | $100 | |
| Case 1 | |||
| No. of Units | C | 5000 | |
| Total Revenue | D = C*B | $500,000 | |
| Margin of Safety | E = D-A | ($108,000) | |
| Case 2 | |||
| No. of Units | C | 10000 | |
| Total Revenue | D = C*B | $1,000,000 | |
| Margin of Safety | E = D-A | $392,000 | |
| Case 3 | |||
| No. of Units | C | 20000 | |
| Total Revenue | D = C*B | $2,000,000 | |
| Margin of Safety | E = D-A | $1,392,000 |
Clearly, the margin of safety goes up as XYZ manufactures and sells a higher No. of units.
Interpretation of Margin of Safety
The margin of safety determines the sales level before it reaches the break-even level. The higher the margin of safety, the lower the risk of breakeven. In the example above, the margin of safety in case 1 is -($108,000) which means XYZ Manufactures are still unable to cover their expenses and hence making a loss. In case 3 where the margin of safety is ($1,392,000) is higher than the margin of safety in case 2 ($392,000). Therefore, in times of some demand issues or in case of a slump in demand, case 1 is more likely to falter in achieving breakeven. While as the margin of safety is quite high in cases 2 and 3, in all likelihood, the company not only will achieve break-even instead will also make some profits and the highest profit could be earned in case 3.
Cautions
The margin of safety may not work in cases of products having seasonal demand as these products may have a very lower quantum of sales in off-seasons. Also, a higher margin of safety may give rise to the high-risk-taking behavior of management. Still, all said, a higher margin of safety is always preferred and keeps the company tension-free.
Also, read the Difference between Breakeven Point vs. Margin of Safety.
