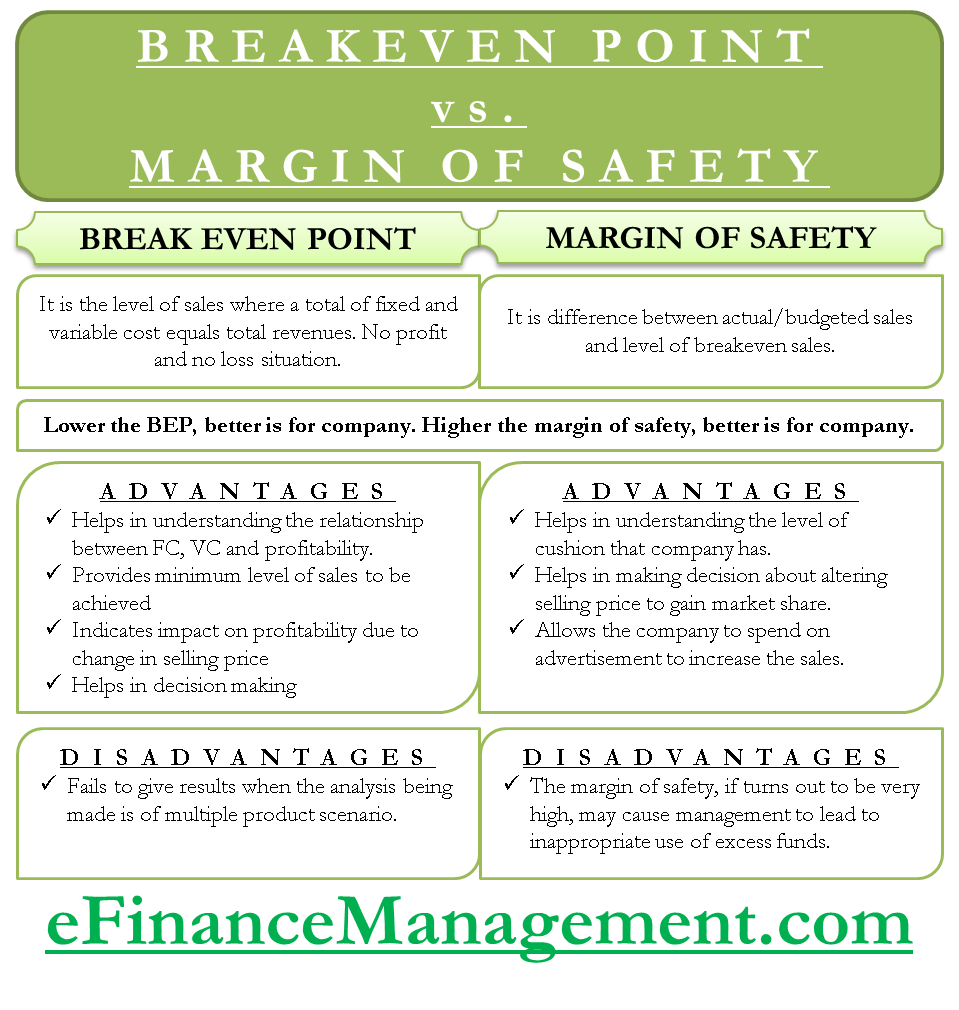
Break-even point (BEP) is the level of sales where total costs (a combination of fixed and variable) equals total revenues. In other words, the breakeven point is a level where the company neither makes a profit nor a loss. A margin of safety (MoS) is a difference between actual/budgeted sales and the level of break-even sales. Let us see in detail the breakeven point vs. margin of safety.
Although the breakeven point (level) and margin of safety fall under the broad domain of cost-volume-profit analysis (CVP Analysis), they differ in various aspects. The main points of difference between the breakeven point and the margin of safety are listed below:
The breakeven point means an amount of sales that cover entire fixed and variable costs. Sales lower than the BEP will result in losses, while sales above the BEP will generate profit after considering all the costs.
As the name suggests, the Margin of Safety is the margin between the actual/budgeted sales and the breakeven point. It denotes the level of safety that the company enjoys before incurring losses (i.e., falling below the breakeven level).
Also Read: Break Even Point
Interpretation of Breakeven Point and Margin of Safety
- The breakeven point is a measure of sustenance, while the margin of safety is a measure of risk.
- The lower the breakeven quantity, the better it is for the companies, while the higher the margin of safety, the better it is for the company.
Breakeven Point vs. Margin of Safety
Here are the key differences between the Break-Even Point and the Margin of Safety:
| Difference | Break-Even Point | Margin of Safety |
|---|---|---|
| Definition | The level of sales or revenue at which a business covers all its costs, resulting in neither profit nor loss. | The difference between the actual or projected sales and the Break-Even Point, indicates the buffer or cushion above the Break-Even Point. |
| Calculation | It is calculated by dividing fixed costs by the difference between the unit selling price and the variable cost per unit. | It is calculated by subtracting the Break-Even Point from the actual or projected sales. |
| Purpose | It determines the sales volume or revenue needed to cover costs and achieve a net income of zero. It helps with pricing decisions and analyzing profitability. | It measures the level of risk or vulnerability to fluctuations in sales volume. It indicates the buffer or cushion a business has above the Break-Even Point and helps assess resilience and potential losses. |
| Interpretation | It indicates the minimum level of sales needed to avoid losses and achieve a neutral financial position. | It indicates the extent to which actual or projected sales can decline before incurring losses and helps gauge the level of risk. |
| Decision-making | It assists in pricing decisions, setting sales targets, and determining the minimum level of activity needed to achieve profitability. | It helps assess the business’s ability to handle unforeseen circumstances, make informed risk management decisions, and plan for contingencies. |
Breakeven Point vs. Margin of Safety: Example
Let us calculate and compare the breakeven point with the margin of safety using the following data.
Sales price per unit = $ 50
Variable cost per unit = $ 30
Total fixed cost = $ 7,000
Total sales quantity = 500 units
Breakeven Point Formula – Equation
Breakeven Sales = Total Variable Cost + Total Fixed Cost
Assuming a breakeven quantity of ‘q.’
The breakeven value of sales will be 50 X q
The total Variable cost will be 30 X q
The total fixed cost will be the same as it does not change with a change in sales quantity.
The formula shall now look as follows:
50q = 30q + 7000 —> 50q – 30q = 7000 —> 20q = 7000 —> q = (7000/20) —> q = 350
Therefore upon solving, the breakeven quantity ‘q’ = 350 units.
Hence the breakeven sales will be 50 X q = 50 X 350 = $ 17,500
The breakeven point can be calculated using a rephrased approach known as the contribution method, which is as follows:
Breakeven Point Formula – Contribution Method
Contribution Per Unit = Selling Price Per Unit – Variable Cost Per Unit
= $ 50 – $ 30 = $ 20
Breakeven Quantity = Total Fixed Cost / Contribution Per Unit
= $ 7000 / $ 20
= 350 units.
Breakeven Sales = 350 (Breakeven Quantity) X $ 50 (Selling Price) = $ 17,500
Margin of Safety Formula
Margin of Safety = Total budgeted or actual sales – Breakeven sales
Assuming Actual Sales = 500 units
= (500 X 50) – (350 X 50)
i.e.,
= 25,000 – 17,500
= $ 7,500
Margin of Safety as a Percentage of Sales = ($ 7,500/ $ 25,000) %
= 30%
Advantages and Uses
- BEP analysis helps understand the relationship between fixed cost, variable cost, and the level of profitability.
- It provides the business with a minimum sales level which the company needs to achieve to avoid losses.
- It also indicates how any change in selling price would impact the profitability and BEP.
- BEP can be used as one of the indicators that help decide whether to manufacture a new product yourself or outsource.
- It helps to know how much cushion the company has if sales decline before the company starts making losses.
- Higher MoS provides freedom to the company’s management to alter the selling price of their product to gain market share from its competitors.
- A higher margin of safety allows the company to spend more on an advertisement or other activities that can help in improving sales in the long run.
Disadvantages
- Break-even point analysis is more appropriate in the case of analysis of a single product at a time; it fails to do so appropriately in the case of a multi-product scenario. Many times it isn’t easy to classify a cost as fixed or variable.
- The margin of safety, which turns out to be very high, may cause management to lead to inappropriate use of excess funds. At times, a higher margin of safety may lead to higher risk-taking behavior of the management, which may not always be required.
Read Angle of Incidence to learn about the relationship between breakeven and margin of safety.
Conclusion
The Break-Even Point focuses on the point where costs are covered and no profit or loss is incurred, while the Margin of Safety measures the buffer or cushion a business has above the Break-Even Point. The Break-Even Point is a reference for analyzing profitability, whereas the Margin of Safety provides insights into risk and resilience. Both concepts are important for financial analysis and decision-making, offering different perspectives on a business’s financial performance and stability.
Quiz on Breakeven Point vs Margin of Safety
This quiz will help you assess yourself on how much you have learned about Breakeven Point and Margin of Safety from the above article.

if
fixed cost = rs 12000
profit = rs 1000
break even sale = 60000
calculate margin of safety
Margin of Safety = Profit/PVR
= 1000/ 20 %
= Rs 5000
PVR = Fixed cost/ BEP * 100
=Rs 12000/ Rs 60000 * 100
= 20 %
It is very useful n easy to understand. But could u please elaborate on certain things like mention the meaning, uses, features, advantages n disadvantages of the all d topics covered under Marginal costing of Third year Bcom. Would be very helpful to all if done specifically.