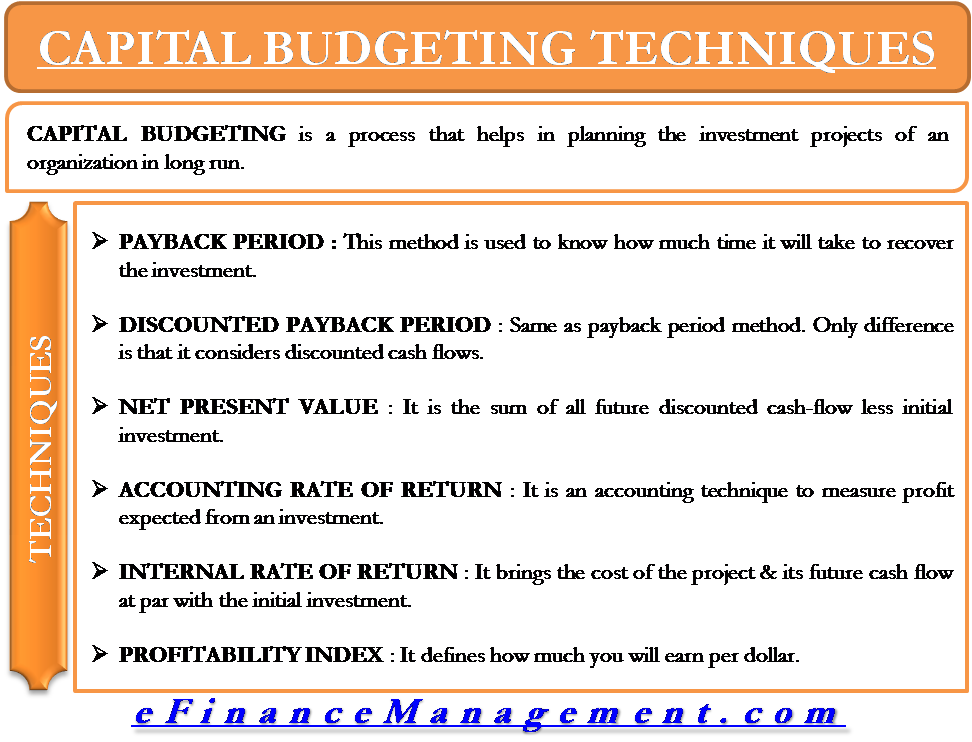
Capital Budgeting Techniques
Capital budgeting is a process that helps in planning the investment projects of an organization in the long run. Let’s understand all the following capital budgeting/investment appraisal techniques with an example.
- Payback period
- Discounted payback period
- Net present value
- Accounting rate of return
- Internal rate of return
- Profitability index
Example of Capital Budgeting
ABC Inc. plans to buy machine A which will cost $ 10 million. The expected life of the machine is 5 years. The salvage value of the machine is nil. ABC Inc. is expecting a cash flow of $ 5 million for the first two years, $ 3 million for the next 2 years & $ 2 million in 5th year. Operating expense is $ 1 million every year. Discounting rate is 10%. (Assumption: No tax)
Now let’s find out the answer by using different techniques.

Payback Period Example
The payback method is used to know how much time it will take to recover the investment.
(Amount in Millions)
| Year | Revenue | Operating cost | Profit | Cumulative Profit |
| 1 | $ 5 | $ 1 | $ 4 | $ 4 |
| 2 | $ 5 | $ 1 | $ 4 | $ 8 |
| 3 | $ 3 | $ 1 | $ 2 | $ 10 |
| 4 | $ 3 | $ 1 | $ 2 | $ 12 |
| 5 | $ 2 | $ 1 | $ 1 | $ 13 |
Here we can see it takes 3 years to generate sufficient profit to recover the cost. So the payback period is 3 years.
Discounted Payback Period Example
This method is the same as the payback period method. The only difference between the payback period & discounted payback period is that it considers the discounted cash flow for finding the payback period.
(Amount in Millions)
| Year | Revenue | Operating cost | Profit | Discounting factor @ 10% | Discounted Cashflow | Cumulative discounted cash flow |
| 1 | $ 5 | $ 1 | $ 4 | 0.9091 | 3.6364 | 3.6364 |
| 2 | $ 5 | $ 1 | $ 4 | 0.8264 | 3.3056 | 6.9420 |
| 3 | $ 3 | $ 1 | $ 2 | 0.7513 | 1.5026 | 8.4446 |
| 4 | $ 3 | $ 1 | $ 2 | 0.6830 | 1.3660 | 9.8106 |
| 5 | $ 2 | $ 1 | $ 1 | 0.6209 | 0.6209 | 10.4315 |
Discounted payback period= 4 years + (10-9.8106)*52 weeks / (10.4315-9.8106). It takes approximately 4 years & 16 weeks.
Net Present Value (NPV) Example
Net present value is one of the most commonly used methods for investment appraisal techniques. It is the sum of all future discounted cash flow less initial investment. If the amount is positive, the project should be accepted; otherwise, it should be rejected.
Also Read: Investment Appraisal Techniques
In discounting payback period, we can see the sum of all future discounted cash flow is $ 10.4315 million & initial investment is $ 10 million. It means NPV is $ 0.4315 million. It is positive; hence the project should be accepted.
Accounting Rate of Return Example
The accounting rate of return is also known as return on investment or return on capital. It is an accounting technique to measure the profit expected from an investment.
The formula of ARR is as follows:
ARR= Average annual profit after tax / Initial investment * 100
Average annual profit after tax = (total revenue – total expense) / 5 years
= ($ 18 million – $ 10 million) / 5 years
= $ 1.6 million
ARR= $ 1.6 million / $ 10 million*100
ARR= 16%
Internal Rate of Return Example
Internal Rate of Return is the discounting rate used for investment appraisal, which brings the cost of the project & its future cash flow at par with the initial investment. It is obtained by the trial & error method. We already have discounted value at a 10% discounting rate.
(Amount in Millions)
| Year | Revenue | Operating cost | Profit | Discounting factor @ 12% | Discounted Cashflow | Cumulative discounted cash flow |
| 1 | $ 5 | $ 1 | $ 4 | 0.8929 | 3.5716 | 3.5716 |
| 2 | $ 5 | $ 1 | $ 4 | 0.7972 | 3.1888 | 6.7604 |
| 3 | $ 3 | $ 1 | $ 2 | 0.7118 | 1.4236 | 8.1840 |
| 4 | $ 3 | $ 1 | $ 2 | 0.6355 | 1.2710 | 9.4550 |
| 5 | $ 2 | $ 1 | $ 1 | 0.5674 | 0.5674 | 10.0224 |
Difference between discounted cash-flow is $ 0.4091 million ($ 10.4315 million – $ 10.0224 million).
IRR = 12 % + (0.0224 * 2 / 0.4091)
= 12 % + 0.11
IRR for the project is 12.11%.
Profitability Index Example
The profitability index defines how much you will earn per dollar. The present value of future cash flow is $ 10.4315 million & investment is $ 10 million.
PI = Present value of cash inflow / Initial investment
PI = $ 10.4315 million / $ 10 million
The profitability index is 1.04315, which means every one dollar invested is generating revenue of $ 1.04315.If the PI is more than 1, the project should be accepted; otherwise rejected.


Dear Sir,
Your website is extremely useful for a person like me who does not have finance background.
Keep posting on regular basis.
Thank you,
P P SINGH
BANKER