What is Demand Function?
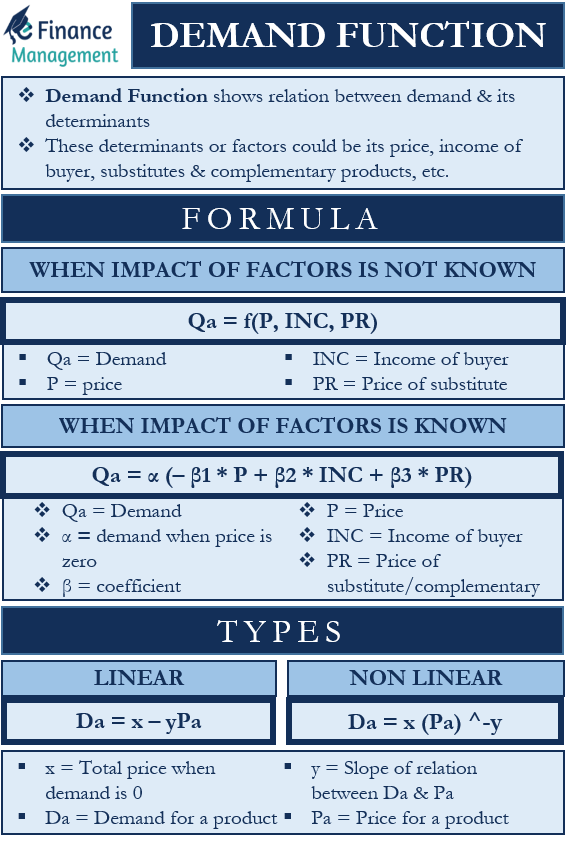
Demand Function shows the relation between the demand and its determinants. Basically, it is a mathematical equation that shows how a demand for a product or service gets affected by its own determinants or factors. These determinants or factors could be its price, income of the buyer, substitutes and complementary products, and more.
We can also say that it is a mathematical representation of the relationship between dependent and independent variables. Also, the demand function shows the type (positive or negative) and intensity (how significantly) of the impact of these factors on demand.
Explanation and Formula
If we have no information on how each factor impacts the demand for a product, then the formula for the demand function will be:
Qa = f(P, INC, PR)
Here price (P), the income of the buyer (INC), and price of substitute (PR) are the factors affecting the demand for the product a. So, the above function says that the demand for product ‘a’ is the function of its price, the income of the buyer, and the price of the substitute.
On the other hand, if we know what and how much impact each of the factors has on the demand, then the function will be:
Qa = α (– β1 * P + β2 * INC + β3 * PR)
Here α is the demand when the price is zero, and all other factors are constant. β here is the coefficient, or it shows the influence of each variable on demand for a product. It must be noted that the sign (positive or negative) of the coefficient will tell what impact the variable has on the demand.
For example, in the above function, a negative β1 means the price has a negative impact on the demand. It means that when the price rises demand drops and vice versa. Also, if the value of β1 is 1, it means a $1 increase in price will reduce the demand by 1 unit, and vice versa.
Example of Demand Function
Suppose the demand for gasoline depends on its price (P), the price of the cars (PC), and the income of the buyer (I).
We measure the demand for gasoline (Qg) in liters, while all other factors are in the U.S. dollar. The price and price of the complementary product have a negative relationship with the demand. So, the demand function, in this case, will be:
Qg = α (– β1 * P + β2 * INC – β3 * PC)
Suppose β1, β2 and β3 are 0.7, 0.2, and 0.03, respectively. This means a $1 change in price will change the demand by 0.7 units. β2 of 0.2 means a $1 change in income will change the demand by 0.2 liters. And, β3 of 0.03 means a $1 change in the price of cars will lead to 0.03 liters change in demand.
Types of Demand Function
They are of mainly two types:
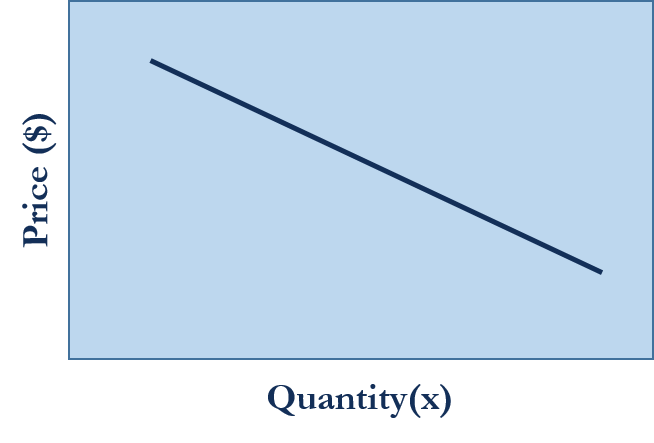
Linear
In this, the slope of the demand curve remains constant. The demand curve is the graphical representation of the law of demand. The mathematical equation of a linear function is:
Da = x – yPa
In this, x represents the total demand when the price is zero, and y is the slope of the relation between Da and Pa. We can also say that y denotes the change in Da for a change in Pa (Da is the demand for a product a, and Pa is the price of the product a). So, if we have the values of x and y, we can get the demand for a product at different price levels.
Suppose the value of x is 20 and y is 2. Now, the demand at a price of $5 will be:
Da = 20 – (2* 5) = 10 units
A point to note is that we can use this function to come up with a demand schedule. For instance, at prices $6, $7, and $8, the demand will be 8, 6, and 4 units, respectively. Now we can use this demand schedule to come up with the demand graph (a linear demand curve).
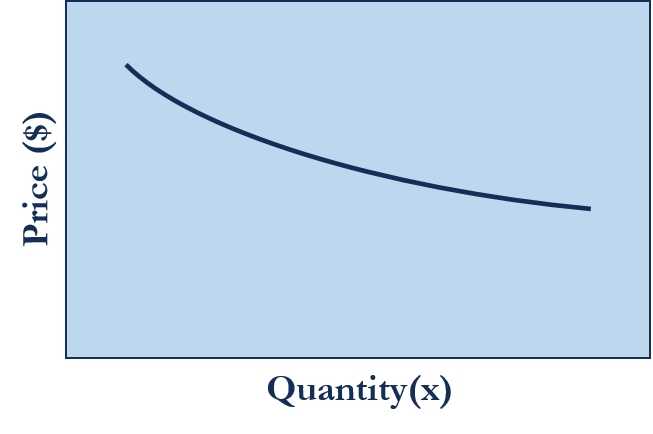
Non-linear
In this, the slope of the demand curve doesn’t remain constant. Another name for this function is the curvilinear demand function. We can mathematically express this function as:
Da = x (Pa) -y
Apart from the above two, demand functions can also be Individual and Market:
Individual – It tells about the demand for a product of an individual. Or, it tells about the quantity that an individual demands at different prices.
Market – It is a function that represents all buyers of a product. If we add individual functions, we will get the market function. Suppose the individual function for gasoline is:
Qg = α – 0.7P
If the market has 100 buyers of gasoline, then the market function will be:
Qg = 100 (α – 0.7P)
