A demand schedule is a table that depicts the relationship between a price and the quantity demanded for a commodity or service. Or, we can say it is a tabular representation of the demand for a product at various price levels. Or, we can also say it is a tabular presentation of the law of demand. We can use the data in the schedule to come up with a demand curve, which is a visual representation of the law of demand.
What does it Include?
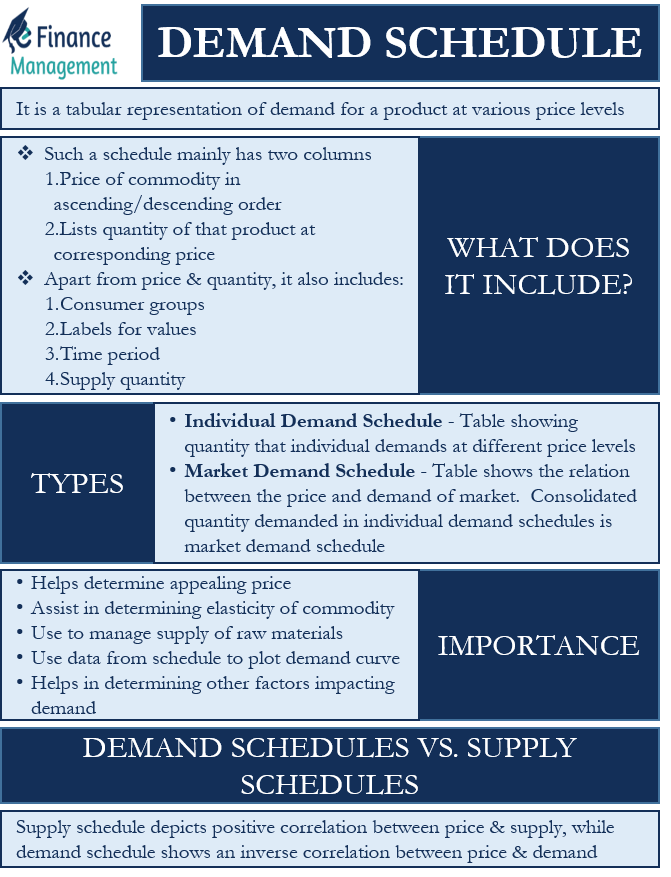
Such a schedule mainly has two columns. The first column shows the price of a commodity in ascending or descending order. And the second column lists the quantity of that product at the corresponding price.
Apart from the price and quantity, there are a few more details that a demand schedule may include. These are:
Consumer Groups
Some schedules may carry detail on where the demand is coming from. For this, the schedule may segregate consumers into different groups.
Labels for Values
This means information on what type of values we are using for the price and quantity. For example, if the price is in U.S. dollar or Indian Rupee, or if the price is per pound, etc.
Time Period
This means information on time or date. Though not all schedules carry time or date information, some that track specific periods or forecast future prices may have this information.
Supply Quantity
This information shows the quantity that the producer is willing to supply at different prices. If we add this information, the table becomes both the demand and supply schedule.
Types of Demand Schedule
Demand schedules are of two types:
Individual Demand Schedule
It is a table showing the quantity that individual demands at different price levels, provided other factors remain constant.
Market Demand Schedule
This table shows the relation between the price and demand of a market. Every user has their own individual demand schedule. When we consolidate the quantity demanded in individual demand schedules, we get the market demand schedule.
Example
Let’s consider a simple example to understand the individual and market demand schedules.
Suppose a market has just two individuals – X and Y. The below table shows the individual schedule of X and Y, as well as the market schedule.
| Price | Quantity Demanded by X (1) | Quantity Demanded by Y (2) | Total Market Demand (3) |
|---|---|---|---|
| $10 | 2 | 4 | 6 |
| $20 | 4 | 6 | 10 |
| $30 | 6 | 10 | 16 |
| $40 | 9 | 15 | 24 |
| $50 | 14 | 22 | 36 |
In the above table, columns 1 and 2 show the individual demand schedules of X and Y at varying price levels. Column 3 shows the market demand schedule, which is nothing but the total of individual demands of X and Y.
A point to note is that the demand function can also be used to prepare a demand schedule.
Importance of Demand Schedule
Analysts and economists can use this schedule to forecast the market demand of a product depending on the price. Apart from these, there are more reasons why such schedules are important:
- It helps to determine the most appealing price. Companies can use these schedules to fix the price at which they would sell their product or service. Plotting the curve from the schedule can give an idea of the price at which the demand is more or less.
- It can also assist in determining the elasticity of a commodity. Elasticity is basically the relation between the price and demand of a product. If a change in price has a drastic impact on the demand, then the elasticity is high. And, if there is no impact, then the product is said to be inelastic.
- Companies can use it to manage the supply of their raw materials. Since schedules can help predict demand, companies can use them to manage the supply of their raw materials. For instance, if the schedule predicts an increase in demand, a company can inform the suppliers accordingly to raise the supply.
- Experts can also use it to determine if any other factors are impacting the demand or not. These other factors could be income, competition, trends, and more.
- We can use the data from the schedule to plot the demand curve. The curve gives a visual representation of the relation between price and demand.
Demand Schedules vs. Supply Schedules
The Supply Schedule shows the quantity of a product that suppliers are ready to supply in the market at different price levels. In other words, we can say that a supply schedule depicts a positive correlation between price and supply, while the demand schedule shows an inverse correlation between price and demand.
We need to use demand and supply schedules together to get a better picture of the market. By plotting both schedules in the form of a curve, we better understand a market’s supply and demand dynamics. Moreover, it gives us an equilibrium point where the supply and demand schedules intersect. This is the point that gives us the equilibrium price and quantity in a market.
RELATED POSTS
- Law of Supply – Meaning, Importance, and Graph
- Material Requirements Planning (MRP) – All You Need To Know
- Direct Materials Budget: Meaning, Components, Format, Advantages, and Variance Analysis
- Forecasting Models
- Anticipatory Inventory – Meaning, Importance, Advantages and More
- Why Does Demand Curve Slope Downward?
