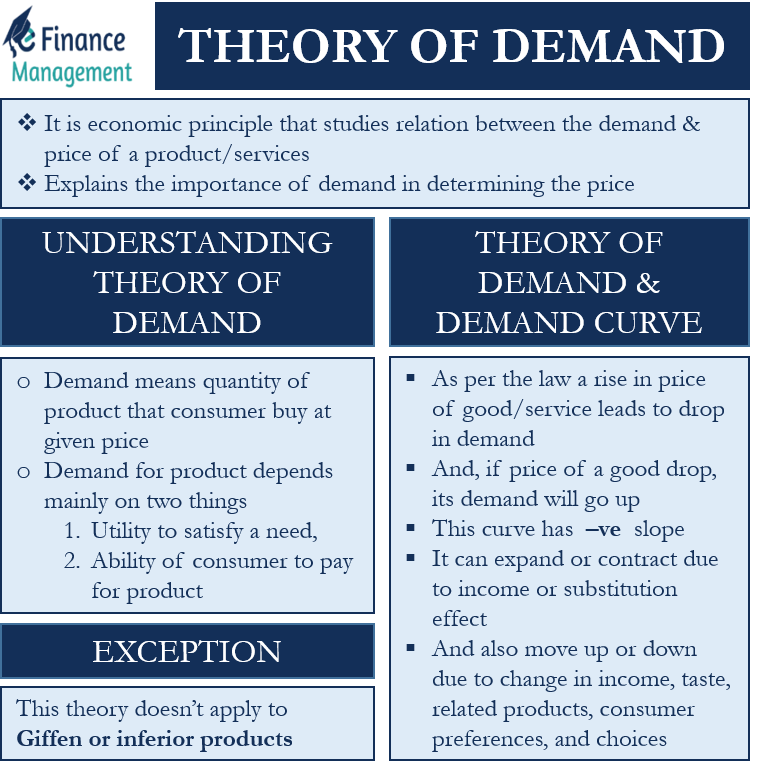
Theory of Demand or Demand Theory is an economic principle that studies the relation between the demand for products or services and their prices. This theory explains the importance of demand in determining the price. As per this theory, as more of a product or service is available, its demand drops, leading to a drop in its equilibrium price.
Understanding Theory of Demand
Demand means the quantity of a product that a consumer can buy at a given price. Also, it reflects the satisfaction that a consumer expects from the product at a given price. A point to note is that the utility or satisfaction of a product varies from consumer to consumer.
Basically, the demand for a product depends mainly on two things. The first is the utility to satisfy a need, and the second is the ability of a consumer to pay for a product. It means demand is actually a demand if the product offers some kind of utility to the buyer and the buyer is capable and willing to buy that product. So, we can say that the real demand is when a consumer is keen to satisfy a need and capable of willingly paying for it.
Laws of supply and demand guide the market and, in turn, help to determine the prices of the products. Prices are at equilibrium when the demand equals supply. If the demand is less than the supply, it will result in a fall in prices due to oversupply.
Also Read: Why Does Demand Curve Slope Downward?
Theory of Demand and the Demand Curve
The law of demand establishes an inverse relationship between the price and demand of a product. As per the law, a rise in the price of a good or service leads to a drop in demand, provided other factors don’t change. And, if the price of a good drop, its demand will go up.
The demand curve effectively demonstrates the relationship between demand and price. A demand curve always slopes downwards, having a negative slope (left to right), showing an inverse relationship between the price and quantity of a product.
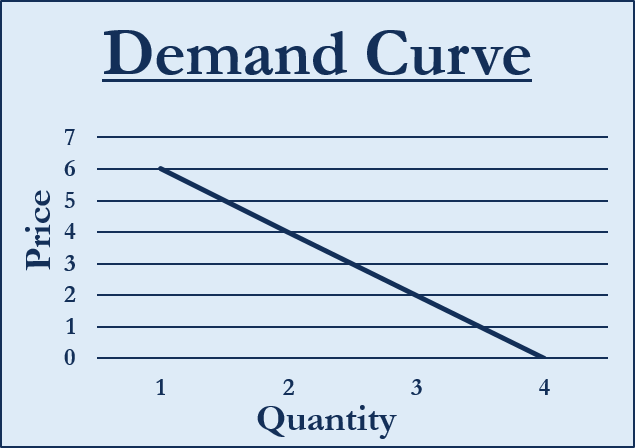
A demand curve could expand or contract (expansion or contraction) due to the income or substitution effect. When the price of a commodity drops, it increases the consumer’s real income. Now, the consumer will be able to buy the same commodity with less money or more quantity with the same money. This is the income effect. Such a phenomenon holds only in the case of normal goods. And, when a consumer starts consuming a costlier product because of its drop in price, it is the substitution effect.
The demand curve could also move up or down (right to left or left to right). We usually witness such a thing when factors other than price impact the demand for a product or service. These factors include income, taste, related products, consumer preferences, and choices. For instance, if a consumer’s income goes up, they would be able to buy more of the product even at the same price. This would shift the demand curve from left to right.
The Exception to Theory of Demand
The theory of demand doesn’t apply to Giffen or inferior products. Giffen or inferior goods are those that witness a rise in consumption even when the price goes up. And, the consumption of these products drops with the drop in their prices. This is because it is hard to find suitable replacements for such goods.
Giffen goods get its name from Robert Giffen, a Scottish economist and statistician. Giffen found that British workers were buying more bread even when there was a rise in its price. Workers did so because the rise in bread prices dropped their purchasing power so much that they were forced to reduce their spending on other expensive foods, such as meat. Since bread was still relatively cheaper, workers increased their consumption of bread.
Final Words
The demand theory primarily helps to answer how the income level and utility impact the demand. So, firms can change the supply and prices of their offering depending on the perceived satisfaction that the product or service offers to the consumers. Thus, for a business, analyzing the demand in the country is one of the most crucial factors as it can help it to survive and grow.

Much Appreciated