Laspeyres Index is one kind of price index. This Index is a method to calculate the CPI (consumer price index) or change in prices over time. This index measures the change in the price of a basket of goods in comparison to their prices to the base year. One can use this index to measure the change in the price level, inflation, as well as the cost of living.
In simple words, we can say that this index answers how much a group of commodities of the base year would cost now. Or what is the change in the price level of those baskets of commodities? We can also call this index a “base-weighted index” because it uses the weights from the base period. Etienne Laspeyres, a German economist, was the first to develop this index.
What makes this index different is that the commodity’s relative price is weighted by the commodity’s relative importance to all purchases during the base year. A commodity’s relative price is simply the ratio of current to base year price. Or we can also say that this index uses the weights of the base year.
Laspeyres Index – How to Calculate?
To calculate this index, we consider the ratio of the total buying cost of a specific group of commodities at the current prices to the buying cost of the same group of commodities in the base year. To convert the same into an indexed form, we do multiplication of the resultant number/ratio by 100.
So, in the numerator, we take the total spending on the basket of commodities in the observation period using the same quantities (weights) as the base year. In the denominator, we take the total spending on the basket of commodities in the base year.
Formula
Below is the formula to calculate the Laspeyres Index:
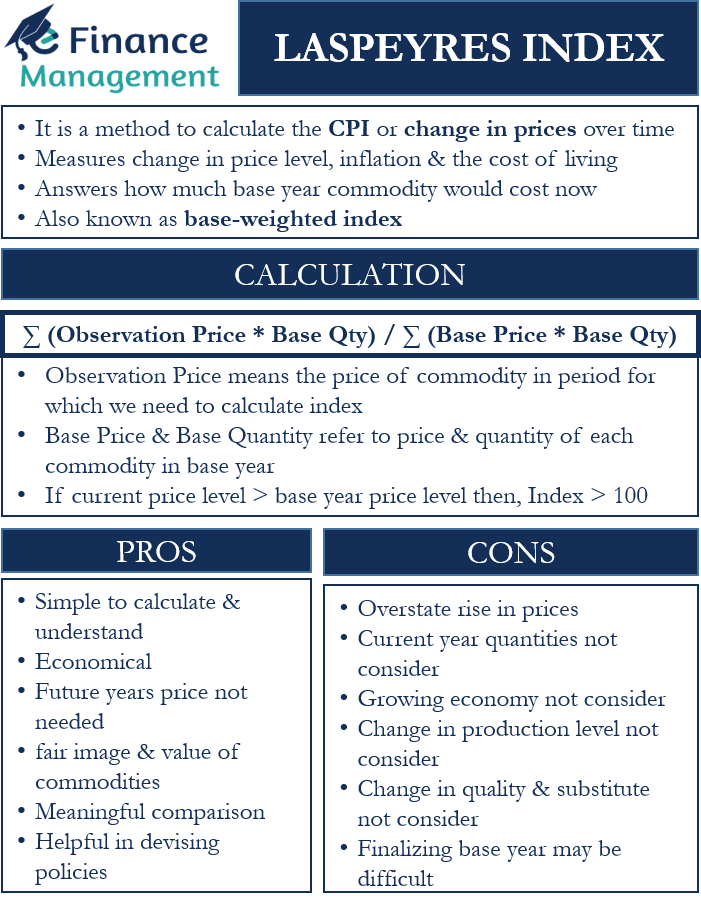
∑ (Observation Price * Base Qty) / ∑ (Base Price * Base Qty)
Here Observation Price means the price of the commodity in the period for which we need to calculate the index. Base Price and Base Quantity refer to the price and quantity of each commodity in the base year, where we keep the index value as 100.
If the current price level is more than the base year price level, then the index would be more than 100. This index assumes the base year figure (Laspeyres Price Index) of 100.
Example of Laspeyres Index
Following are the prices of commodities A, B, and C in Year 0: $20, $30, and $40, respectively. Following are the prices of commodities A, B, and C in Year 1: $50, $60, and $70, respectively. And following are the prices of commodities A, B, and C in Year 2: $80, $90, and $100, respectively.
Following are the quantities of commodities A, B, and C in years 0: 20, 40, and 60, respectively. Following are the quantities of commodities A, B, and C in Year 1: 30, 50, and 70, respectively. And following are the quantities of commodities A, B, and C in Year 2: 40, 60, and 80, respectively. Year 0 will be the base year.
Now first, we will calculate the Laspeyres Index for Year 1.
Putting the values in the formula, we get = {($50*20) + ($60*40) + ($70*60)} / {($20*20) + ($30*40) + ($40*60)}
So, Laspeyres Index for Year 1 will be 190.
Now, we need to calculate the index value for Year 2.
Putting the values in the formula, we get = {($80*20) + ($90*40) + ($100*60)} / {($20*20) + ($30*40) + ($40*60)}
So, Laspeyres Index for Year 2 will be 280.
The above values suggest a rise in the prices in Year 1 and Year 2. This is because the value of the index rose from 100 in Year 0 to 190 in Year 1 and then to 280 in Year 2. So, we can say there is a 2.8 times rise in the prices from Year 0 to Year 2.
Advantages and Disadvantages
These are the advantages of the Laspeyres index:
- It is simple to calculate and understand.
- It is economical as the data is easily available.
- One does not need to calculate the quantities of the future years because it uses only the base year quantities.
- This index gives a fair image and value of the commodities because it considers the base year quantities (and not of observation year).
- It offers a meaningful comparison because a change in the index represents the change in the price.
- The findings of the index help devise policies to manage inflation.
Following are the drawbacks of the index:
- This index could overstate the rise in prices.
- It does not consider the quantities in the current or observation year.
- This index does not take into account the growing economy. Also, it does not consider any change in the production level over the years. Moreover, it also overlooks new players in the market.
- Another thing that this index does not consider is the change in the quality and the presence of substitute goods. Changes in the quality and availability of substitute goods can change the consumption pattern. And thus, it can make a significant impact on commodity prices. The Index, to that extent, may not be showing the actual picture.
- Finalizing the base year may get difficult as well.
Laspeyres Index and Upward-bias
Its biggest drawback is that it suffers from an upward bias, or it could overstate the rise in prices. Thus, it could also overestimate price levels, as well as inflation. This upward bias or overstatement of price rise could be due to the following three reasons:
The first is that the price of a commodity may arise because of any quality improvement. One must not consider such a rise in price as inflation.
And the second reason is that people generally substitute commodities that have become expensive with relatively cheaper ones.
The third reason for an upward bias is that over time, more expensive new goods come into the market and replace the old ones.
In all, we can say that when prices go up, buyers change their purchasing behavior and preferences. When prices go up for a commodity, buyers start to buy fewer quantities of that product and more of those items that show less or no price change. So, if the total satisfaction level does not go down, then the use of base-year commodities could overstate the drop in the standard of living and inflation.
Final Words
Laspeyres Index is one of the most popular tools to calculate the change in the general price level, mainly the Consumer Price Index. Economists and policymakers regularly use this index to come up with financial and economic policies for the betterment of society.
