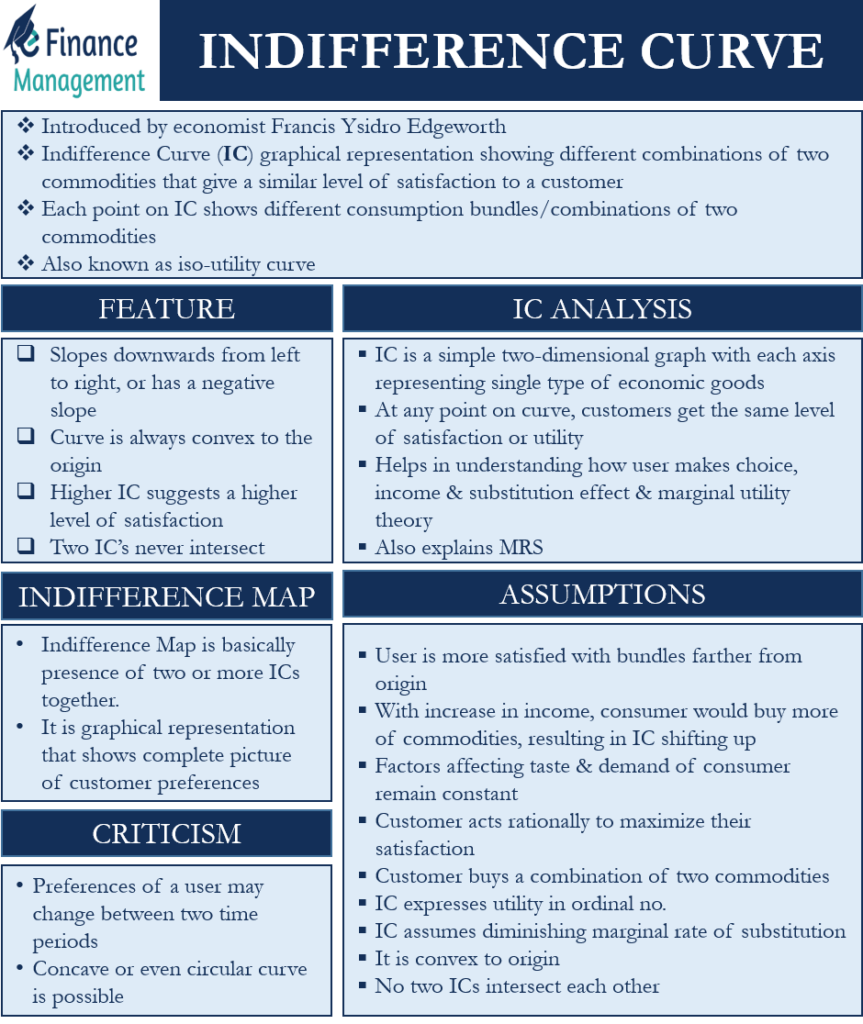
Indifference Curve (or IC) is an economic phenomenon that helps understand customer preference. It is basically a graphical representation showing different combinations of two commodities that give a similar level of satisfaction to a customer; hence, the customer is indifferent between them. At every point on the curve, the customer is indifferent as they get the same level of utility at those points.
Each point on the indifference curve shows different consumption bundles or combinations of two commodities. We can say that this economic concept analyses the commodity combinations, budget constraints, as well as preferences of customers.
British economist Francis Ysidro Edgeworth was the first to propose the IC. Another name for this curve is the iso-utility curve.
Features of Indifference Curve
Following are the main features of an indifference curve:
- It always slopes downwards from left to right, or it has a negative slope. The reason for a negative slope is that if a customer wants to get one more unit of commodity A, then they need to reduce the quantity of another commodity so that the total utility remains the same.
- This curve is always convex to the origin. We can attribute this to the law of diminishing marginal utility, as a user will always want to forgo fewer units of a commodity to consume extra units of the other commodity.
- A higher IC suggests a higher level of satisfaction, or a user gets more satisfaction with bundles that are farther from the origin. This is because a higher IC reflects more quantity of at least one commodity. Also, economic theories assume that consumers always prefer bigger bundles, i.e., those with more of both commodities.
- Another feature is that two IC’s never intersect. Also, the curve never touches the X- and Y-axis. This is because if the curve does touch any axis, it would mean the assumption of a customer buying a bundle (two commodities) of goods doesn’t hold. It would mean that the customer is buying only buying one commodity.
Assumptions of Indifference Curve
An indifference curve makes the following assumptions:
- A user is more satisfied with bundles on the IC that are farther from the origin.
- With an increase in income, a consumer would buy more of the commodities, resulting in IC shifting up.
- All other factors affecting the taste and demand of a consumer remain constant.
- Customer acts rationally to maximize their satisfaction.
- The customer buys a combination of two commodities.
- IC expresses the utility in ordinal numbers.
- IC makes an assumption of a diminishing marginal rate of substitution.
- It is convex to the origin.
- No two ICs intersect each other.
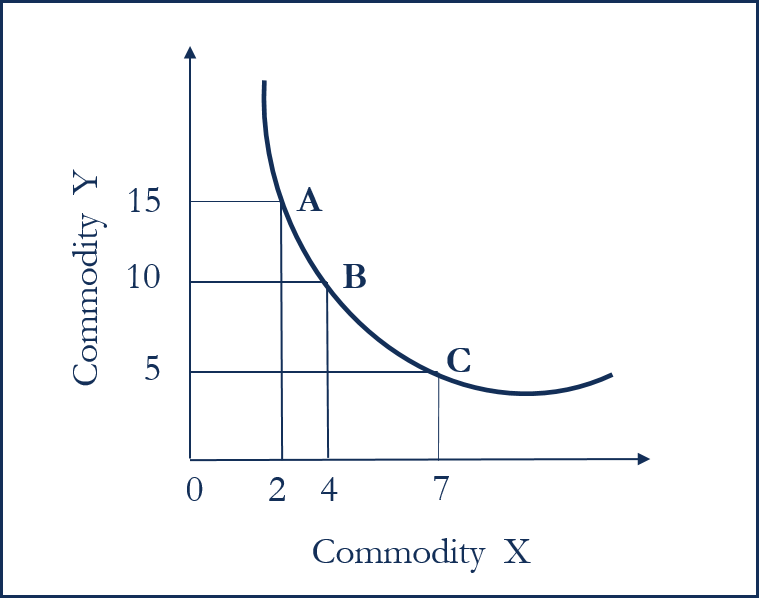
Indifference Curve Analysis
An indifference curve is a simple two-dimensional graph with each axis representing a single type of economic goods. At any point on the curve, the customers get the same level of satisfaction or utility. For example, a kid may be indifferent between a toy or two comic books.
As said above (in the Features section), a consumer is more satisfied with bundles that are farther from the origin or those on the higher IC. Such a scenario generally arises when the income of a user rises. It would allow the consumer to buy more of the commodities, resulting in a new indifference curve that is farther from the origin.
Also Read: Ordinal Utility – Meaning and Assumptions
Thus, we can say that IC can help in understanding how consumers make optimal choices with a given level of income. Moreover, analyzing IC can provide an understanding of many other concepts, including how a user makes a choice, income and substitution effect, as well as the marginal utility theory.
Also, IC helps to explain the MRS (marginal rates of substitution) and the opportunity costs. MRS is basically the slope of an IC. It tells the rate at which a user can sacrifice one commodity for another. For example, if a kid values toys, then he will be slow to give them up for a comic. Thus, the slope or MRS will reflect this substitution rate.
Example
Suppose Mr. A has 4 pens and 8 pencils. Now, if we ask Mr. A how many units of pencils will he be okay to sacrifice to get an additional unit of pen so that his level of satisfaction remains the same?
Mr. A agrees to give up 2 pencils for one unit of a pen. This results in two combinations:
– 4 pens and 8 pencils
– 5 pens and 6 pencils
In this example, the Marginal Rate of Substitution (MRS) or the slope of the IC is 2. MRS is basically the rate at which a user is willing to substitute one commodity for another. So, in the above case, MRS is 2.
The MRS will change if, suppose now, Mr. A is willing to give up only one unit of pencil for one unit of a pen. So, the MRS now will be 1.
Indifference Map
An Indifference Map is basically the presence of two or more ICs together. Such a graphical representation shows the complete picture of customer preferences.
We now know that a user is indifferent to the points that are there on an IC. But, if there are two or more ICs, then the customer would prefer the combination of commodities lying on the IC that is further away from the origin. It is because a higher IC means a more level of satisfaction.
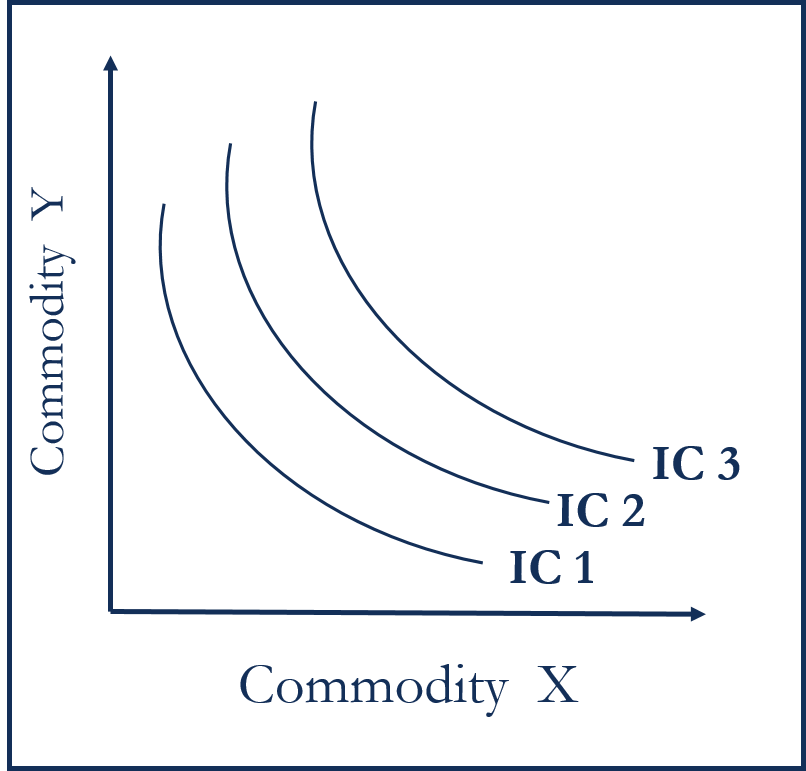
Suppose in an Indifference Map there are three ICs (IC1, IC2, and IC3), with IC3 being further away from the origin. In this case, all the combinations on IC2 offer a higher level of satisfaction than those on IC1, and all combinations on IC3 offer a higher level of satisfaction than those on IC2.
Criticism of Indifference Curve
Like many other economic concepts, most criticism against IC is because of its oversimplifying or unrealistic assumptions. Also, many economists argue that the preferences of a user may change between two time periods. Some economists believe that having a concave or even a circular curve is possible.
If we leave out these criticisms, then the indifference curve is the most popular and one of the best explanations of customer preferences.
RELATED POSTS
- Law of Diminishing Marginal Utility
- How to Calculate Indifference Point?
- Law of Equi Marginal Utility – Meaning, Assumptions, and Importance
- Theory of Demand – Meaning, Demand Curve, Exception, and Graph
- Cardinal Utility – Meaning, Assumptions, Advantages, and Disadvantages
- Marginal Utility – Meaning, Importance, Factors, Types, and Graph
