What is the Marginal Rate of Transformation?
Marginal Rate of Transformation (or MRT) is an economic concept that helps to measure the opportunity cost. MRT shows the number of units of a product that one needs to sacrifice to make one unit of another product.
How does MRT Work?
If the resources are limited, then to make one more unit of a product, we will have to divert resources from other products. This will reduce the units produced for the other product. So, we can say that the MRT measures this trade-off.
Below is the formula to calculate the MRT:
MRT=MCy / MCx
Here MCx is the marginal cost to make or avail an extra unit of X. And MCy is the marginal cost to produce or avail an additional unit of Y.
For instance, if there are two commodities, X and Y, then MRT will measure the units of Y that need to be cut to produce or avail an additional unit of X. If producing one less unit of X would free up enough resources to make 3 units more of Y, then MRT will be 3 to 1. If two commodities are the perfect substitutes, then the MRT will be 1, as well as remain constant.
Also Read: Production Possibility Frontier: Meaning, Assumptions, Graphical Curve, Interpretation, and More
In other words, we can say that MRT helps in determining the economic priorities given a limited amount of resources. So, MRT helps analysts examine the opportunity costs to make one more unit of a product. The opportunity cost, in this case, is the lost production of another commodity.
PPF and Marginal Rate of Transformation
Like MRS (marginal rate of substitution) is tied to Indifference Curve, MRT is tied to the PPF (production possibility frontier). PPF shows the possible production of two commodities with a given amount of resources. MRT is the slope (or the absolute value) of the PPF. Every point on the PPF has a different MRT.
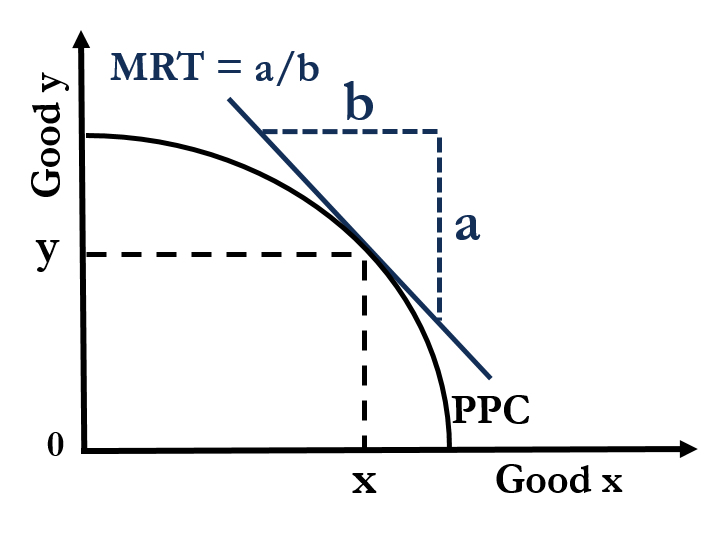
The opportunity cost or the value of MRT rises as we move down the PPF. It means that as we produce more units of a product, the opportunity cost (in terms of units) of the other product also increases. Such a process is similar to the law of diminishing returns.
For a business that operates on an efficient PPF, it is impossible to produce more of one product without reducing the production of another product. This means the business will have to divert some resources from one product to increase the production of the other.
In contrast, a business on inefficient PPF won’t be reducing the production of one to increase the production of another. Instead, the company would work to reallocate resources to make more of both products. Also, the business may use unutilized resources to boost the production of both.
MRT vs. MST
Both the marginal rate of transformation and the marginal rate of substitution (MRS) are similar in concept. Yet, there are many differences between the two. These differences are:
- MRS is related to demand, but MRT is related to supply.
- MRS shows the number of units that a consumer needs to forgo of one commodity to get one more unit of another commodity. But MRT shows the number of units that one needs to sacrifice to produce one extra unit of another commodity.
- As said above, MRS relates to the Indifference Curve, or MRS is the slope IC. On the other hand, MRT relates to the production possibility frontier (PPF).
Limitations of Marginal Rate of Transformation
Following are the limitations of MRT:
- It is usually not constant, and thus, there could be a need to re-calculate it frequently.
- If MRT doesn’t equal the MRS, then the distribution of commodities won’t be efficient. To understand this, refer to the graph below.
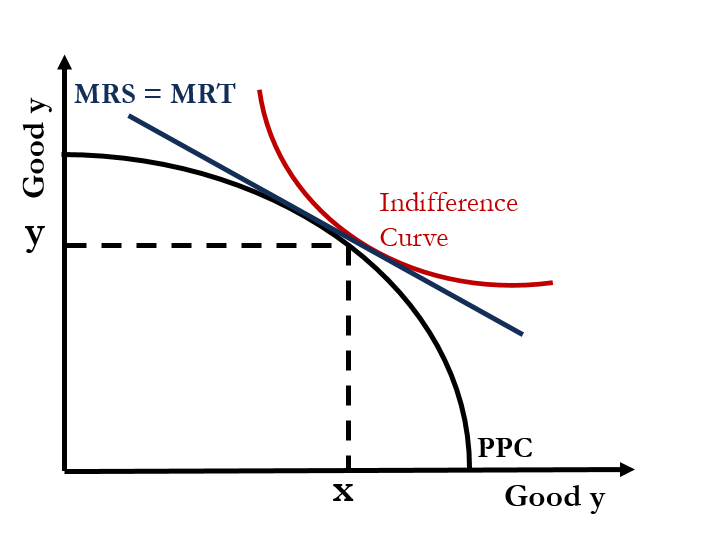
In the graph, the red curve is the indifference curve (IC) showing different bundles of two commodities that offer equal utility or satisfaction to a consumer. The black curve is the PPF. Only at the point where the IC and PPF touch each other is it possible to maximize the utility of the consumer and the output of the producer. This is the point at which the MRS is equal to the MRT. Thus, this point represents the optimal level of consumption and the maximum efficiency.
