A statement of cash flows is one of the three types of basic financial statements, along with the balance sheet and income statement. This three-statement model helps the investors gauge the performance of the company in terms of profitability, financial position, and movement of cash.
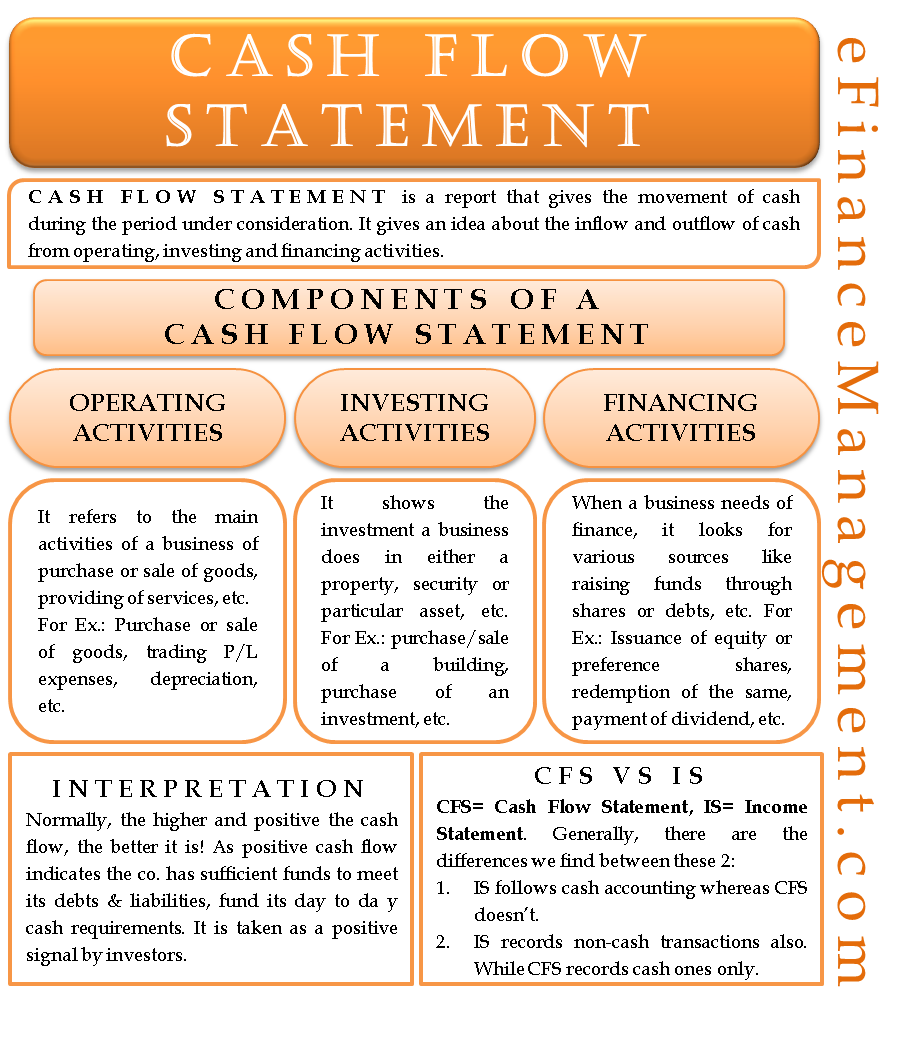
A cash flow statement encapsulates all movement of cash in a business for a period. It provides an idea about the inflow and outflow of cash from operating, investing, and financing activities. Therefore, studying the components of a cash flow statement makes a good starting point for understanding how money movement takes its course in an organization.
Components of a Cash Flow Statement
A cash flow statement is divided into 3 sections. Each head signifies the source from which a company can make money. A positive cash flow indicates cash inflows, whereas a negative cash flow indicates cash outflows.
Cash Flow from Operating Activities
This includes cash arising out of the core business the company is in. The difference between the revenue generated out of the sales of the products and the cost will be cash flow from operating activities. For example, purchases or sales of a product, increase or decrease in current assets and current liabilities, depreciation, expenses relating to trading, administrative, selling expenses, etc.
Also Read: Cash Flow Vs. Fund flow
Cash Flow from Investing Activities
Cash flow from investing activities shows the investment a company makes. It includes cash spent in capital expenditures or the cash raised out of a sale of long-term assets or any other form of investment.
Cash Flow from Financing Activities
A company will look to expand its business from time to time. To finance this, the company will either raise equity or debt. This comprises cash flow from financing activities.
Example of a Cash Flow Statement
Below is the sample structure of the same.
Cash Flow Statement as on the date of Balance Sheet (All figures are in million USD)
| Particulars | Current FY | Previous FY |
|---|---|---|
| (A) Cash Flow from Operating Activities | ||
| Profit before tax | 1000 | 900 |
| Depreciation | 100 | 100 |
| Tax | -300 | -250 |
| Net Cash Generated from Operating Activities | 800 | 750 |
| (B) Cash Flow from Investing Activities | ||
| Purchase of Fixed Assets | -100 | -50 |
| Sale of Fixed Assets | 50 | – |
| Net cash used in investing activities | -50 | -50 |
| (C) Cash Flow from Financing Activities | ||
| Equity generated | 100 | 100 |
| Dividend paid | -20 | -20 |
| Net Cash Generated from Financing Activities | 80 | 80 |
| Net Cash Flow (A+B+C) | 830 | 780 |
| Cash and Cash equivalent as at Balance Sheet Date | 830 | 780 |
Interpretation of Cash Flow Statement
From the above statement, for the current financial year, it can be seen that the cash generated is USD 830 million. It is pretty likely that the profit will be greater than USD 830 million. Ideally, a company with high cash flows is more equipped to pay its debts and finance its day-to-day operations seamlessly. Investors perceive higher cash inflows as a positive signal.
How is it Different from an Income Statement?
There are 2 main differences between a cash flow statement and an income statement:
- An income statement follows accrual accounting, whereas a cash flow statement does not. Thus, entries in it are recorded only when money exchanges hands.
- The income statement also records non-cash revenues and expenses. The cash flow statement is strictly for cash transactions only.
Cash Vs. Profit
It gives the investors an idea about the ability of a company to meet its future obligations. Suppose an income statement shows a net profit of $100. In that case, it does not mean that the company has increased its cash repository by $100 because the income statement also reports non-cash transactions. But the bottom figure of $100 in a cash flow statement certainly means that the company has increased its cash deposits by $100 during the previous accounting period.
Continue reading – Cash Flow Management.

Please check the calculation for cash flow from operation. i think the depreciation should be added here
Thanks Sunit for the suggestion. We have incorporated the same in our Post.
I’m impressed, I have to admit. Genuinely rarely should i encounter a weblog that’s both educative and entertaining, and let me tell you, you may have hit the nail about the head. Your idea is outstanding; the problem is an element that insufficient persons are speaking intelligently about. I am delighted we came across this during my look for something with this.
This is great work
VERY KNOWLEDGE ORIENTED AND CONCEPTUAL CLARIFICATION WITH EASE.