Beta Definition
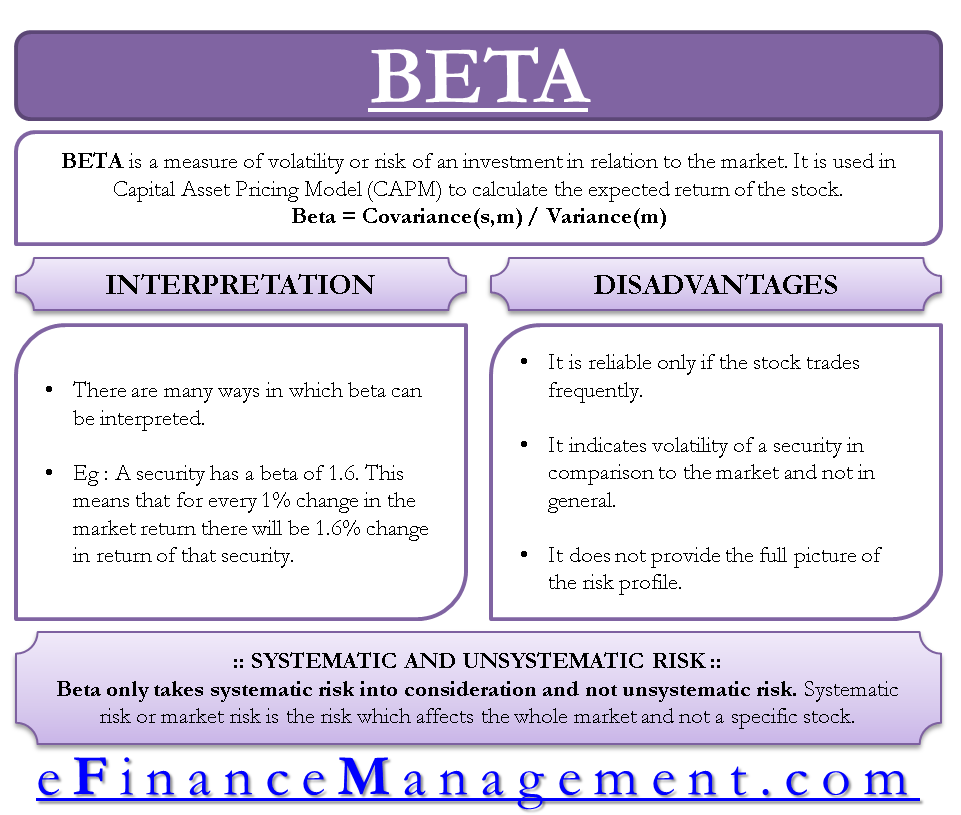
Beta is a measure of volatility or risk of a stock in relation to market risk. Also known as the beta coefficient (β), the capital asset pricing model (CAPM) uses beta to calculate the expected return of the stock.
Formula of Beta
Beta (β) = Covariance (ri,rm)/Variance (rm)
i.e.,
Beta = [(Correlation(ri,rm) x Standard deviation (ri))/Standard deviation (rm)]
- ri= returns of a security
- rm= market returns
Beta can be calculated by dividing the covariance between the security returns and market returns with the variance of market returns. It can also be calculated by first dividing the standard deviation of security returns by the standard deviation of market returns. The resulting value is then multiplied by the correlation between security returns and market returns.
Covariance (ri, rm)
It measures the degree to which the returns of a security and market returns move in tandem with each other. Market returns are generally calculated from the returns of indexes like S&P 500, NASDAQ, NIFTY 50, etc. The indexes are formed in a way that they represent the whole market. It lies between -∞ to +∞. This means that the covariance can be negative as well. A negative covariance determines that the movement is in the opposite direction, while a positive covariance defines movement in the same direction. It is denoted as CoV in short.
Variance and Standard Deviation
The variance shows how far the values are from the mean. Standard deviation is the root of the variance. Standard deviation measures the risk or volatility. For example, the Standard deviation of security returns measures the fluctuations of security returns around the mean of security returns.
Also Read: Beta Calculator
Correlation (ri,rm)
It measures how strong the linear relationship between security and market returns is. If the correlation is +1, then both variables are moving in the same direction with a strong linear relationship. If the correlation is -1, both variables are moving in the opposite direction with a strong linear relationship.
Explanation with Example
An example would help in providing more clarity on the concept.
Suppose an investor wants to calculate and compare the Beta of X Ltd. and Y Ltd. Variance of X Ltd. is 0.0085, while the variance of Y Ltd. is 0.0075.
Beta of X Ltd. = 0.0085 / 0.0075 = 1.133
Beta signifies the change for every 1% in one variable causing the change in another variable. In the example above, the security of X Ltd. is 13.33% riskier than the security of Y Ltd.
Refer to Beta Calculator
Systematic Risk and Unsystematic Risk
Beta only takes systematic risk into consideration. The systematic risk or market risk is the risk that affects the whole market and not a specific stock, For Example- changes in interest rates, inflation, recession, war, etc. This risk affects the entire economy, so it cannot be avoided. One can moderate this through hedging.
Beta does not take into consideration the unsystematic risk. Unsystematic risk is the risk that specifically affects a particular company or industry and not the whole market. For example – a lawsuit is filed against a company, a strike by employees in the company, poor management team, etc. This risk can be avoided by investing in different stocks and diversifying your portfolio.
Interpretation of Beta
Beta is a very convenient and easy-to-interpret quantitative measure. It uses regression analysis to measure volatility. It indicates whether the security is more or less risky than the overall market. There are many ways in which we can interpret beta. For example, a security has a beta of 1.6. This means that for every 1% change in the market return, there will be a 1.6% change in return of that security. It can also be said that this security is 60% more risky or volatile than the overall market.

The value of beta depends on the past data, and the period is taken into consideration for calculation. The past is not always a good predictor of the future. The company might change its risk profile in a few years, and that information will take time to reflect in the company’s beta. So, the value of beta will keep changing over time.
Disadvantages of Beta
- The beta will be reliable only if the stock trades frequently. The conclusions might be biased if you find out the beta of an illiquid stock.
- Beta just indicates the volatility of a security in comparison to the market and not in general. Security might be risky in nature but not correlated with market returns (β=0). So, it should be used cautiously.
- It does not provide the full picture of the company’s risk profile. It can be useful for measuring short-term volatility, but long-term investors will find it less useful. Long-term investors will have to include multiple factors along with market risk to get a full picture.
Also read – Hamada Equation.
