What do we Mean by Technical Analysis?
Technical Analysis is a method to analyze how the price of financial security will move in the near future on the basis of its past performance. The security may comprise stock, commodity, currency, etc. The historical data an analyst uses for such analysis comprises the security’s price movement and volume of trading. Statistical trends are calculated, which an analyst studies to predict future movements.
The basis of Technical Analysis is the notion that there is a high probability that in the near future, security will perform similarly as it performed in the past. Also, the chances of deviation from its past path are few. An analyst uses a number of statistical tools and calculations to support this notion and chart out the future path. Some of these are moving averages like arithmetic mean, weighted averages, resistance, and support levels, standard deviation, Bollinger bands, etc.
- What do we Mean by Technical Analysis?
- What are the Assumptions of Technical Analysis?
- What makes Technical Analysis different from Fundamental Analysis?
- What Inputs does Technical Analysis use?
- What are the Approaches to Technical Analysis?
- Advantages and Disadvantages of Technical Analysis
- Investor Approach
What are the Assumptions of Technical Analysis?
The following assumptions are the basis of Technical Analysis:
Past Trends Decide the Future
The basis of Technical Analysis is the belief that past trends decide the future course of any security. There is a cyclical movement in the case of the prices of securities. The bull market and the bear market usually perform in an alternate trend. Similarly, the prices of securities also follow a cyclical trend when we look at the broader picture.
Thus, analysts study how factors in the market and changes in those factors affect the prices of securities. Charting of these patterns is done, and after a thorough study of these charts, the projections or predictions of future price movement are made.
Pricing is the Key Deciding Factor
Technical Analysis believes the fact that the pricing movement of security reveals everything about it. There is no need to study other factors in detail like the financials of a company, its management details, future prospects, the economy, and its effect, etc.
This assumption is based on the logic that the above factors have already been factored in to arrive at the price of the security. If the pricing is good, the security will be in high demand, and its trading will be done in large volumes. If the pricing is wrong, there will be no or little demand, and hence, there will be a little volume of trade. Thus, it gives very little importance to fundamental analysis and assumes that technical analysis is the key to trade in any security.
What makes Technical Analysis different from Fundamental Analysis?
Key Beliefs
Technical Analysis believes that the pricing of security and the volume of its trade is most important in deciding the future price movements of a security. On the other hand, Fundamental Analysis analyzes the financial statements of a company, the quality of its assets and liabilities, the quality of the company’s management, economic conditions in which a company has to operate, etc. to decide the future trends of the security price movements of a company. After a thorough study of the above factors, it arrives at the intrinsic value of the securities. And if the intrinsic value is more than the current market price, then the analyst recommends a buy with an expectation that the price will rise to the level of its intrinsic value. The situation will be reverse if the prevailing market price is more than the projected intrinsic value. Here the analyst will recommend a sale.
Qualitative and Quantitative Factors
The basis of Technical Analysis is solely quantitative factors that affect the price movements of any security. Fundamental Analysis considers both quantitative and qualitative factors such as market competition, interest rates, economic situation, etc. Also, the fundamental analysis aims to find the true value of a security and whether it is worth buying at the current market price. This is unlike technical analysis, that only finds the future price trajectory of the security and not its worthiness.
Also Read: Fundamental Analysis
Read Fundamental vs. Technical Analysis for a more detailed article.
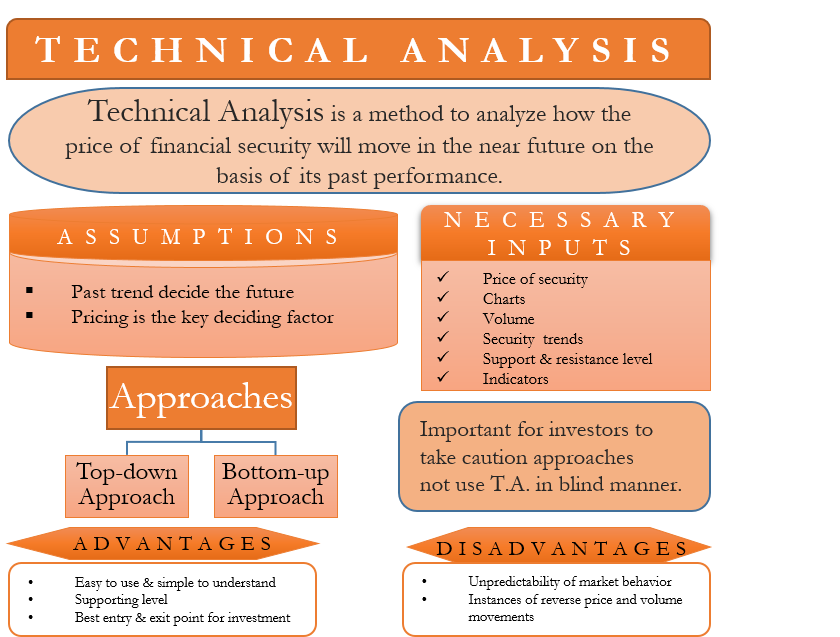
What Inputs does Technical Analysis use?
Price of the Security
The historical and current price of the security is the most important input analysts use for technical analysis. They use the price trends to chart the future pricing pattern of the security.
Charts
Analysts make extensive use of charts to visually present the changes in price and trade volume of the security over a period of time. They make use of several types of analysis, as well as statistical tools like moving averages and ratios to forecast the price trajectory of the security correctly.
The different types of charts that analysts use are line charts, candlestick charts, bar charts, etc.
Volume
Volume is another key measure that analysts use in technical analysis. It is the quantity or number of securities traded over a period of time at different prices. A large trade volume will mean that the security pricing is correct and vice-versa.
Security Trends
Analysts observe the historical trends of security price movements and their trade volume to ascertain the future trajectory of the security. Along with trends, analysts study the market momentum of security. Momentum is the rate at which the security price goes up or down over a period of time.
Support and Resistance Levels
The support level is the minimum price level at which the demand for security will prevent the price from going down further. Resistance is the upper price level at which the demand for security will start falling to keep the prices in check. Analysts examine where the security’s current market price is between these two levels. This helps to decide in which direction the price will move according to historical trends and the present level.
Indicators
There are several key indicators that analysts use for technical analysis. These indicators are based on price and volume statistics of the security and help to prepare charts. These include volatility, money flow, momentum, moving average convergence and divergence, high low index, etc.
Lagging indicators use past data for calculations and explain the security price, whereas the leading indicators are based on future expectations and prices.
What are the Approaches to Technical Analysis?
Top-down Approach
The analysts who use this approach do a broad-view analysis of the entire economy. They don’t just focus on the price of the security. They would first look at the economy or major indices. Then they will further move towards studying sectors, companies, and then the security at hand. The analysts would be more interested in looking at the short-term or even daily or hourly movements and charts of the security to find the correct price for purchasing that security.
Bottom-up Approach
The bottom-up approach aims to figure out which securities are undervalued. Then the analysts find the rock bottom point or perfect timing to buy those securities. Hence, analysts using this approach look to pinpoint individual securities rather than the sector or the economy as a whole. Thus, this approach has a long-term view. It intends to benefit from the bottom point of prices.
Also, read Top-down vs. Bottom-up Investing.
Advantages and Disadvantages of Technical Analysis
Let us first look at the advantages of Technical Analysis.
- It is a simple and easy-to-use method to prepare a good future road for investing.
- It helps to find the best entry and exit points for investing in security.
- Technical Analysis helps to arrive at the support and resistance levels.
- An increasing number of investors will cluster around these levels by using technical analysis results. Big clusters or crowd mentality will ensure that the patterns repeat themselves, thus making Technical analysis more reliable.
The unpredictability of market behavior and doubtful repetition of historical investment patterns are the biggest disadvantages of Technical analysis. There can be instances of reverse price and volume movements. This can be so when a large number of investors start making investment decisions on the basis of technical analysis results. This may force the market to go in the opposite direction.
Investor Approach
Therefore, it is important for investors to take a cautious approach. They should not use Technical Analysis results in a blind manner. They should first try to use a demo model and see if they can really profit from the results. Also, investors should invest in small amounts first to see the results and then go big. Slowly and steadily, they will learn to develop tactics to deal with the unfortunate situation of markets behaving in an opposite manner than what the Technical analysis results say. A careful approach while following the technical analysis results can definitely help investors make profits and benefit.
The approach to risk management is one important point to be considered for investing based on the results of the technical analysis. The investor needs to understand and appreciate that however best is the analysis, it is an estimate or probability only. Hence, the investor should limit his losses by existing when the movement is not in line with the predictions.
