Hamada equation distinguishes the financial risk from the business risk of a levered firm. A levered firm’s capital structure consists of both equity and debt. Sometimes, when the debt increases more than optimal, it also increases the cost of equity and debt. It would lead to a new and increased cost of fresh capital. Hamada equation is applied to measure the increased cost of equity due to the increased financial leverage.
What is Hamada Equation?
Hamada Equation is developed by Robert Hamada, former professor of finance at the University of Chicago. Equation first appeared in his paper about capital structure and systematic risk in the Journal of Finance in May 1972. Hamada equation mixes the Modigliani – Miller theorem on capital structure with the Capital Asset Pricing Model, calculating the cost of equity capital.
This equation distinguishes the financial risk from that of the business risk of a levered firm. A levered firm’s capital structure consists of both equity and debt. Unlevered firms are firms that are financed by only equity.
Hamada equation is used when financial leverage is exercised. (It refers to the use of borrowed funds to obtain new assets which are supposed to generate more profits):
Also Read: Hamada Equation Calculator
- when the debt increases more than the optimal level,
- here the cost of equity changes, and the new cost of equity to be ascertained
- to measure the increased cost of equity due to financial leverage.
The Hamada equation reflects the change in beta with leverage. As the beta of the coefficient rises, the risk associated also rises. Here beta is the indicator of systematic risk concerning the market.
Hamada Formulas
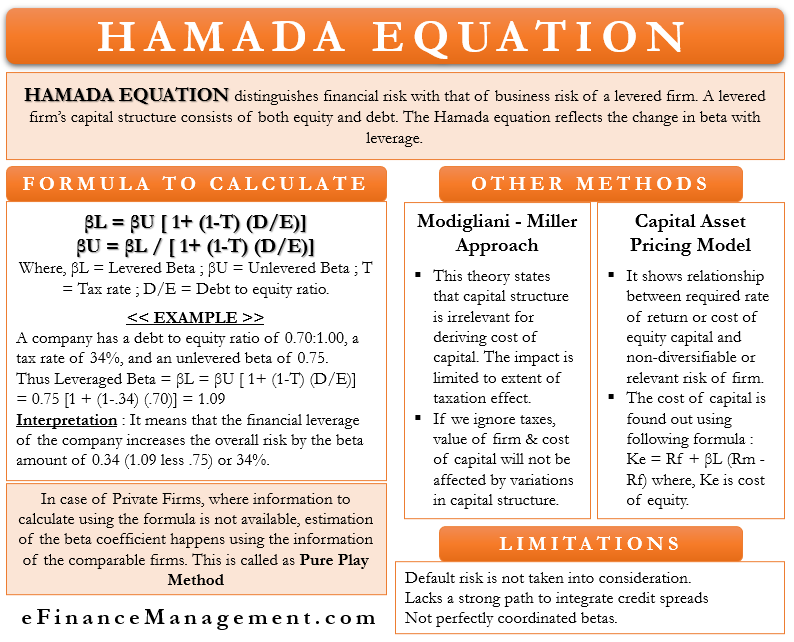
βL = βU [ 1+ (1-T) (D/E)]
βU = βL / [ 1+ (1-T) (D/E)]
Where,
βL = Levered Beta
βU = Unlevered Beta
T = Tax rate
D/E = Debt to equity ratio.
- Levered Beta calculates the risk associated with the proposed capital structure/funding pattern of the business at various levels or compositions of debt and equity.
- Unlevered Beta calculates the risk with a capital structure not comprising any debt.
- The debt to equity ratio shows the contribution, composition, and relationship of both these sources of finance – equity and debt. The funding of the business happens mainly through these two sources in, one or the other form.
Beta or Levered Beta
It is a meter showing the systematic risk of a company relative to the market. As we know, all the markets and securities have investment risks that affect the pricing and return of the security. These risks are of two types – Systematic and unsystematic risks. One: Macro-economic or market-specific risk called systematic risk. Systematic risk, being related to the entire economy and uncontrollable, cannot be reduced in the normal course. Hence, it is also called a non – diversifiable risk. Another risk is company-specific risks or risks related to the company’s performance, called Unsystematic risk. Diversification of securities is the solution for reducing unsystematic risk.
For some firms, they have high debt (that is not optimal, the optimal debt to equity ratio is that it should not exceed 2:1. It makes the investment in the company riskier and increases the uncertainty of earnings. When comparison happens between the two companies that have different debt proportions are compared. Suppose the debt increases more than the required level; financial risk is assumed. The type of market risk beta captures does not assume financial risk. In such cases removing the effect of debt (debt effect =1+ (1-T) (D/E) ) is the solution. Which leads to unlevering the beta. The information to unlever beta is available from the firm’s financial statements. Unlevered beta, also called asset beta, helps to show the asset risk compared with the overall market.
Steps for Calculation
1: Divide the company’s debt by Equity
2: 1 – Tax rate
3: Find out the product of Step 1 and Step 2 (Debt to equity ratio × 1-T)
4: Multiplying the result of Step 3 with the unlevered beta.
Hamada Equation Example
A company has a debt to equity ratio of 0.70:1.00, a tax rate of 34%, and an unlevered beta of 0.75.
The Hamada coefficient or leveraged beta would be:
βL = βU [ 1+ (1-T) (D/E)]
0.75 [1 + (1-.34) (.70)] = 1.09
Here, the leveraged beta is 1.09,
Interpretation
It means that the financial leverage of the company increases the overall risk by the beta amount of 0.34 (1.09 less .75) or 34%. Therefore, as the beta of the coefficient rises, the associated risk of having higher debt also rises.
Pure Play Method
Details or information on unlevered and levered data are available in financial statements. In the case of private companies, such information will not be publicly available. So, the calculation/estimation of the beta coefficient happens using the information of comparable firms.
Unlevering Beta Example
- Consider company A has a Debt-Equity ratio of 0.4 and a tax rate of 30%.
- Here, no information regarding beta is available. So, a comparable company operating in the same industry, having the same product line, risk factor, etc., will be referred.
- Let’s assume a similar company; company B has a beta of 1.2, a debt to equity ratio of 0.45, and a tax rate of 32%.
- Let’s now remove the effect of leverage from the beta of the company B (unlevering the beta):
βU = βL / [ 1+ (1-T) (D/E)]
= 1.2 / [ 1 + (1-.32) (.45)]
= .92
- The next step is to adjust company B’s unlevered beta for company A.
βL = βU [ 1+ (1-T) (D/E)]
= .92 [1 + (1 – 0.3) (.4)]
= 1.18
It is the method of unlevering beta. This example suggests that as the debt-equity ratio is lower, the beta is also lower in this case for company A.
So, by calculating the Hamada Equation and levered beta value, we can ascertain the risk profile of the company where debt financing is a source of finance. Moreover, we can establish the likely increase or decrease in the risk profile in line with the change in the debt-equity ratio.
In summary, Hamada Equation also supports that the capital structure or debt-equity ratio of a company decides the cost of capital of the company. However, there is a theorem propagated by Modigliani that capital structure or the composition of debt and equity of a firm does not affect the cost of capital, and it will remain the same. Let’s understand that theory also.
You can also use Hamada Equation Calculator.
Modigliani – Miller Approach
It came out with a theory that the capital structure is irrelevant for deriving the cost of capital. The impact is limited to the extent of the taxation effect. Thereby, if we ignore taxes, the value of the firm and the cost of capital will not be affected by the variations in the capital structure. That means the decision on capital structure is immaterial because the equity-debt mix does not affect the firm’s overall value. The present value of future earnings and its underlying assets determines the market value of the firm and not the capital structure.
The above discussions lead us to a few essential characteristics of investments.
- There is a cost of capital for every company. The debt-equity ratio does have an impact on the cost of capital. And the cost of capital varies with the change in this ratio.
- There are systematic and unsystematic risks involved in all investments.
- Every investor looks forward to getting a reasonable return over and above the cost of capital.
- In an investment portfolio, the investor should reduce or minimize the impact of unsystematic risk, i.e., company-specific or security specific.
- Not putting all eggs in one basket or diversification is the solution for reducing the unsystematic risk. CAPM helps us in this job.
Capital Asset Pricing Model (CAPM)
It shows the relationship between the required rate of return or the cost of equity capital and the non-diversifiable or relevant risk of the firm. We have discussed the nature and type of risks- Systematic and Unsystematic. Diversification of securities is the preferred solution for reducing the unsystematic risk of the portfolio of securities.
CAPM Formula:
Ke = Rf + βL (Rm – Rf)
Where,
Ke = cost of equity capital
Rf = risk-free rate of return
βL = beta of a security
Rm = return on market portfolio
Limitations of Hamada Equation
- The default risk is not taken into consideration.
- Lacks a strong path to integrate credit spreads, even though there is some effort to modify the default risk into the Hamada equation. Credit spread is the difference between two bonds having similar maturity but different credit quality. Like no difference between the U.S Treasury bond and another debt security with other quality but having the same maturity.
- Not perfectly coordinated betas.

Dear Sir,
Kudos to your commendable efforts to update all of us. Will you please guide us with Diminishing Fair value of loan account on Restructuring & Rate of Recompense in the present day scenario of Rescheduling of loan due to pandemic.
Thanking you in advance!!
Easiest explanation.all the concepts are clearly explained.😍
This is very informative
This is the only article with the whole info regarding Hamada equation. Thank you. Great work.